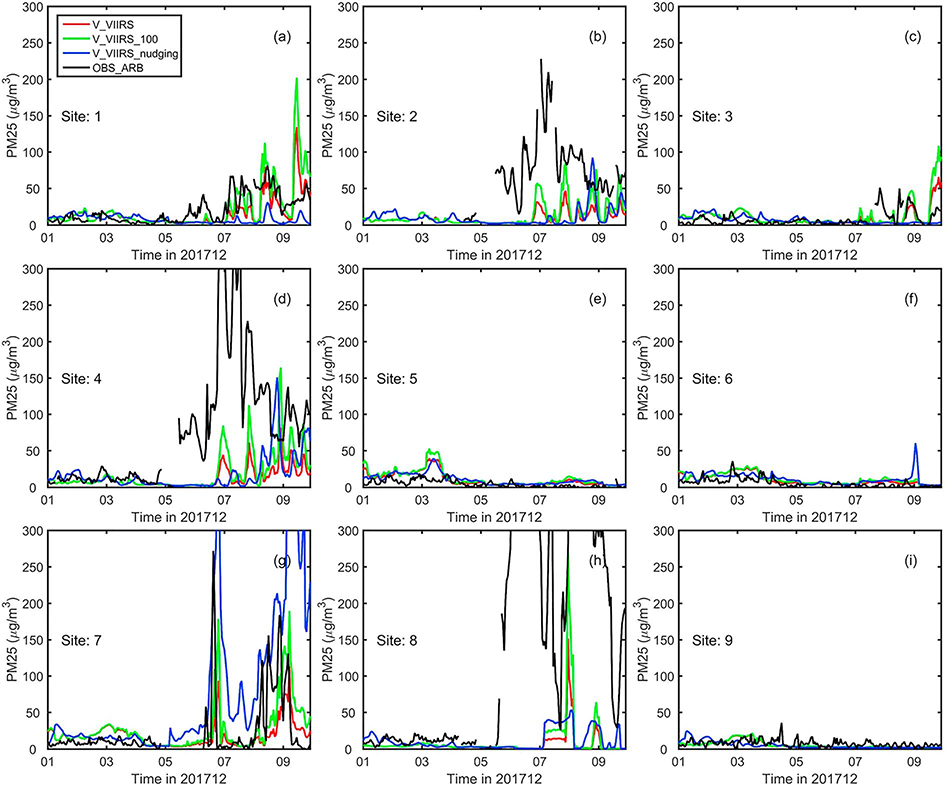
Figure 9.
Time series of hourly concentration of PM2.5 at nine sites around wildfires during the period of 1 to 9 December 2017. The black line is observed hourly PM2.5 concentration. The red, green, and blue lines are simulation results from V_VIIRS, V_VIIRS_100, and V_VIIRS_nudging, respectively. VIIRS = Visible Infrared Imaging Radiometer Suite.

