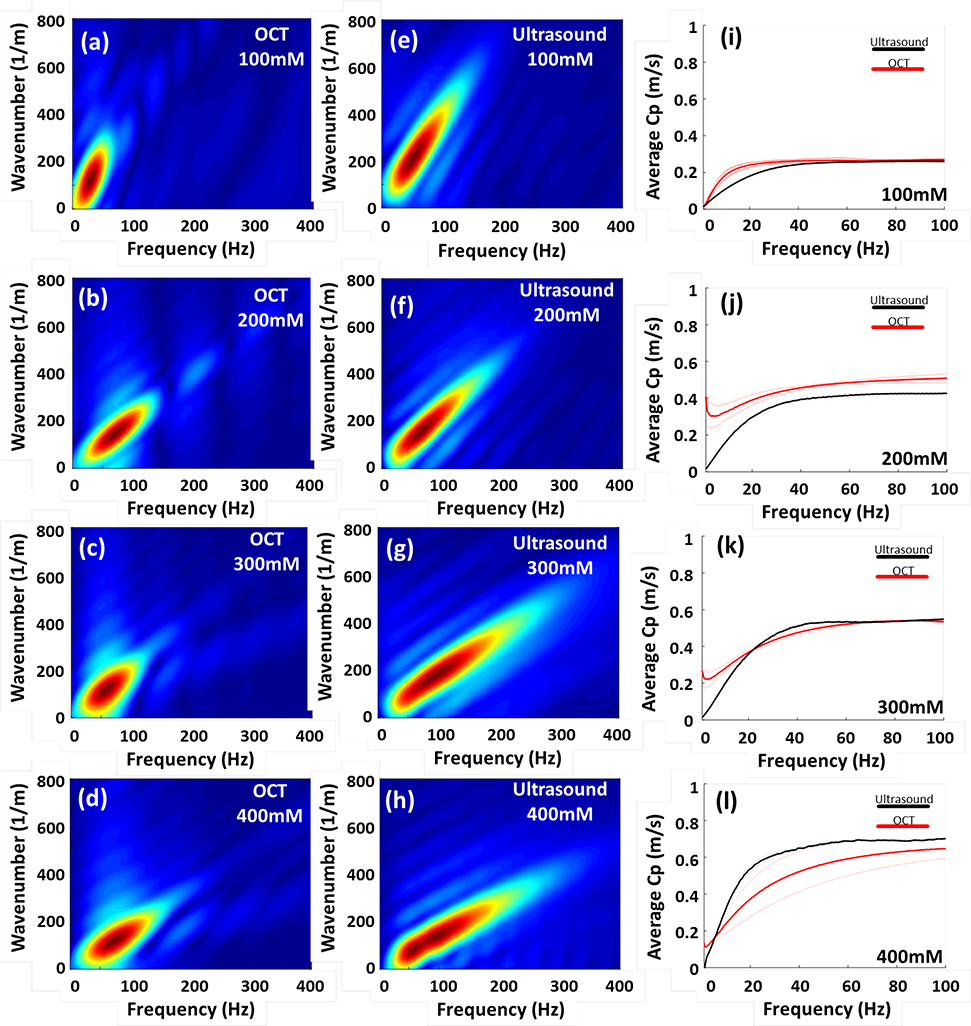
Fig. 3.
Illustration of k-space and phase velocity measurement in soft condensed matters-micellar fluids in the four concentrations. Figure (a-d) demonstrate that OCE is capable of measuring viscosities of Rayleigh waves of micellar fluids with the four concentrations. Figure (e-h) shows the phase velocities of shear waves, obtained by SWE, in the k-space in each concentration. The average dispersion curves with the standard deviation (SD) in each concentration were displayed in figure (i-l). The thick and thin lines represented average phase velocities and SD, respectively.

