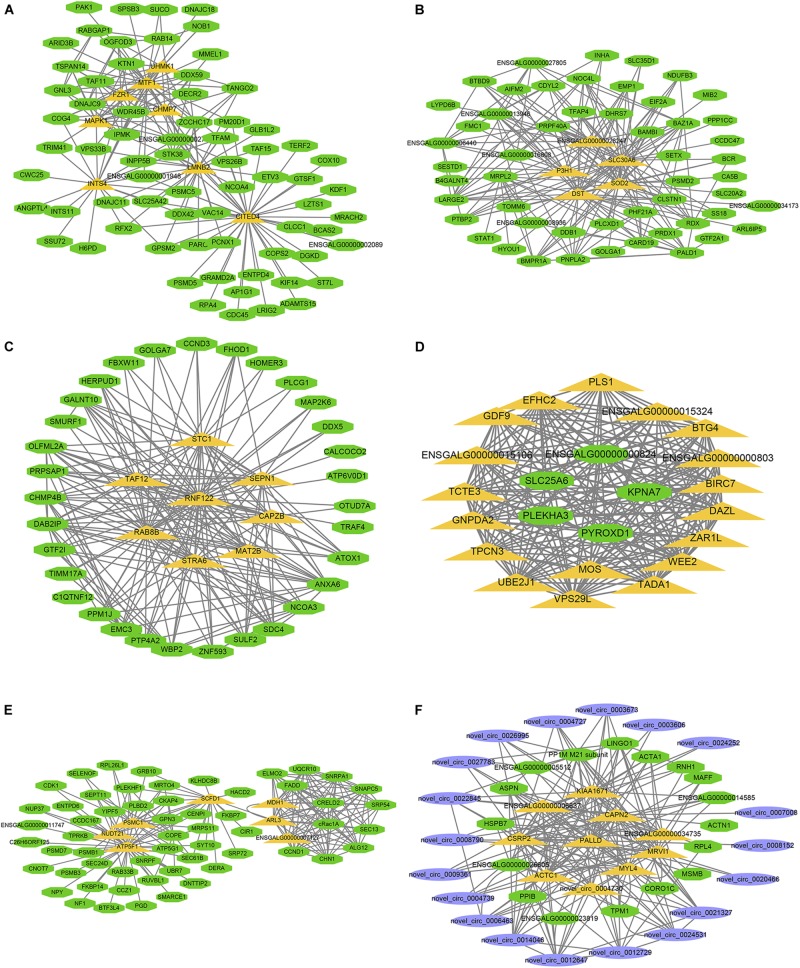
FIGURE 10.
Visualization of hub genes in specific module. Network of (A–F) represent top hub genes in module darksegreen4, brown4, darkred, lightgreen, ivory, and skyblue, respectively. Green nodes represent protein-coding gene, blue nodes represent circRNA, orange nodes represent highly connected intramodular hub genes with edge number ≥ 15.

