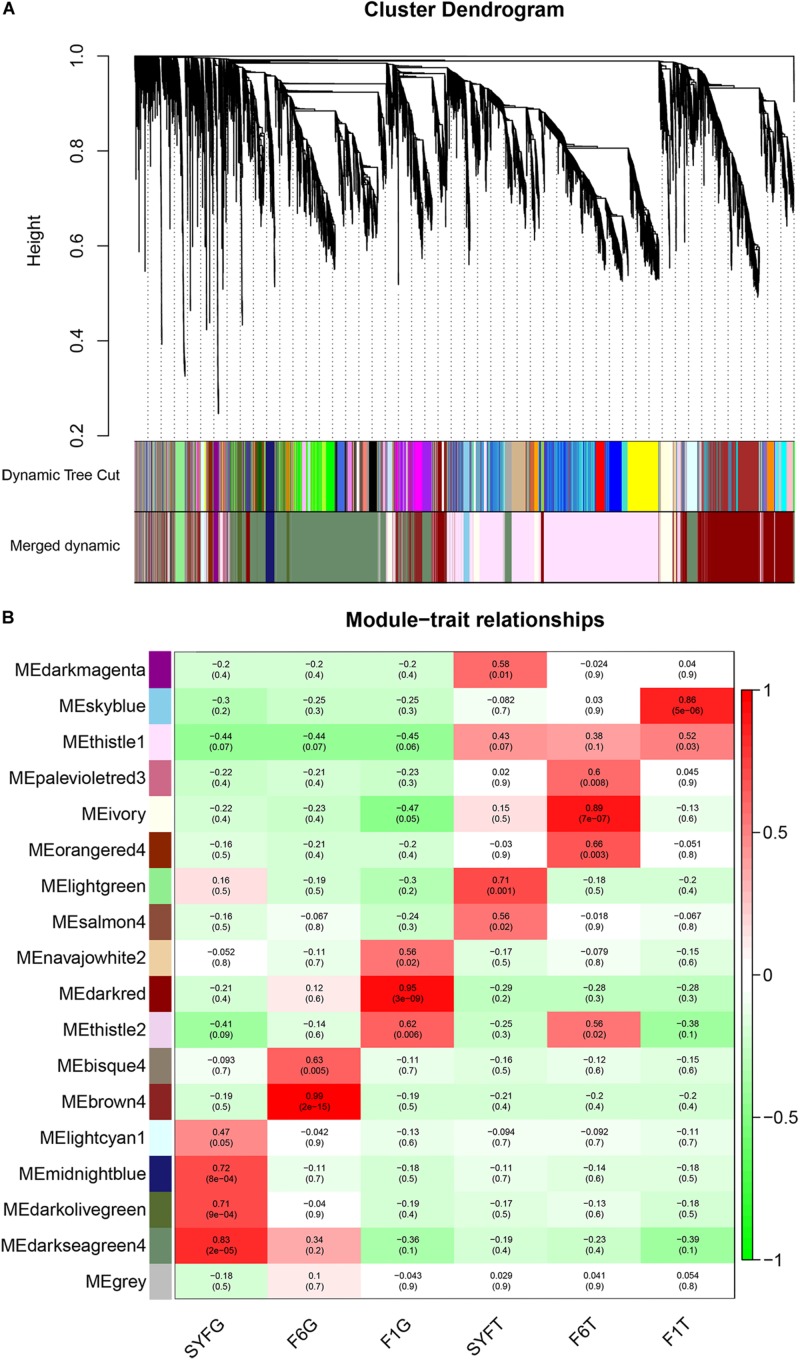
FIGURE 8.
Visualization of transcripts co-expression modules and module-trait relationships. (A) Visualization of transcripts co-expression modules, clustering dendrogram of transcripts, with dissimilarity based on topological overlap; (B) Module-stage/tissue relationships and corresponding p-values, on the left, different colors represent different modules. Each cell contains the correlation and p-value given in the parentheses. Red, positive correlation; green, negative correlation; white, none correlation. SYF, small yellow follicle; F6, the smallest hierarchical follicle; F1, the largest hierarchical follicle. G, granulosa cells; T, theca cells.

