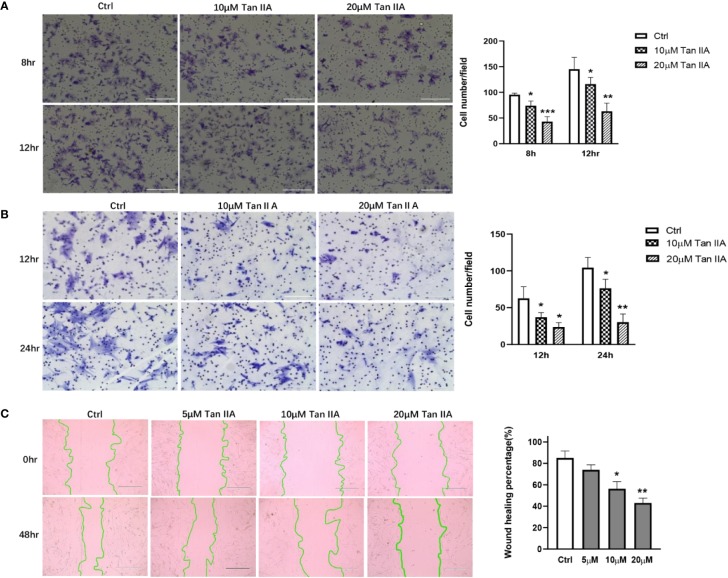
Figure 3.
Tan IIA suppresses the migration and invasion of RA-FLSs. (A) The effect of Tan IIA on migration was detected with transwell Boyden chamber after 8 and 12 h. The images are representative of migration or invasion through the membrane after staining. Original magnification 200× (left panel). Cell numbers/field are presented as the mean ± SD of eight independent fields (right panel). (B) The effect of Tan IIA on invasion was detected with a transwell Boyden chamber coated with a Matrigel basement membrane matrix after 12 and 24 h. The images are representative of migration or invasion through the membrane after staining. Original magnification 200× (left panel). Cell numbers/field are presented as the mean ± SD of eight independent fields (right panel). (C) The effect of Tan IIA on wound healing was detected with cell scratch assay. After 48 h, the wound area was photographed using a microscope. Original magnification 100× (left panel). The extent of wound closure is presented as the percentage by which the original scratch width had decreased at each measured time point. The values are the mean ± SEM from at least 3 independent experiments (right panel). *P < 0.05, **P < 0.01, ***P < 0.001 vs. 0 μM (Ctrl).

