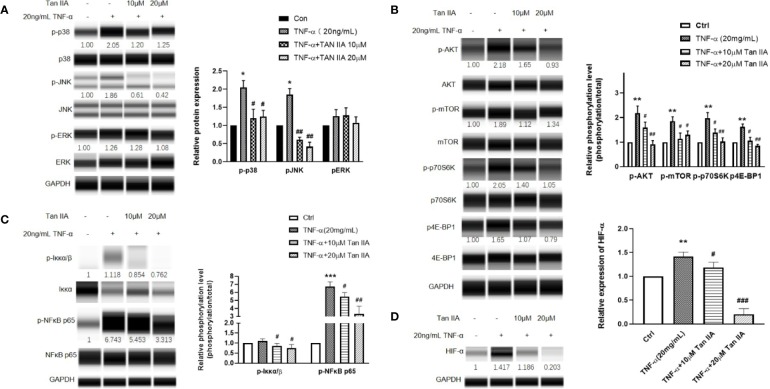
Figure 6.
The effect of Tan IIA on the intracellular phosphorylated activation of the MAPK and Akt/mTOR pathway induced by TNF-α in RA-FLSs. RA-FLSs were treated with TNF-α (20ng/mL) or/and Tan IIA (10 and 20 μM) for 24 h. (A) Western blot analysis was conducted to assess the expression and phosphorylation levels of p38MAPK, JNK, ERK, and FAK. Representative images of immune blot (left panel) and densitometric quantification phosphorylation/total of p38MAPK, JNK, and ERK expression (right panel). (B) Western blot analysis was conducted to assess the expression and phosphorylation levels of AKT, mTOR, p70S6K, and 4E-BP1. Representative images of immune blot (left panel) and densitometric quantification phosphorylation/total of AKT, mTOR, p70S6K, and 4E-BP1 expression (right panel). (C) Western blot analysis was conducted to assess the expression and phosphorylation levels of Iκκα and NFκB p65. Representative images of immune blot (left panel) and densitometric quantification phosphorylation/total of Iκκα and NFκB p65 expression (right panel). (D) Western blot analysis was conducted to assess the expression level of HIF-α. Representative images of immune blot (left panel) and densitometric quantification of HIF-α expression (right panel). Densitometry analysis from three independent experiments was used to quantitate the protein expression. *P < 0.05, **P < 0.01, ***P < 0.001 vs. Ctrl (0 μM Tan IIA), #P < 0.05, ##P < 0.01, ###P < 0.001 vs. group treated by TNF-α (20 ng/mL).

