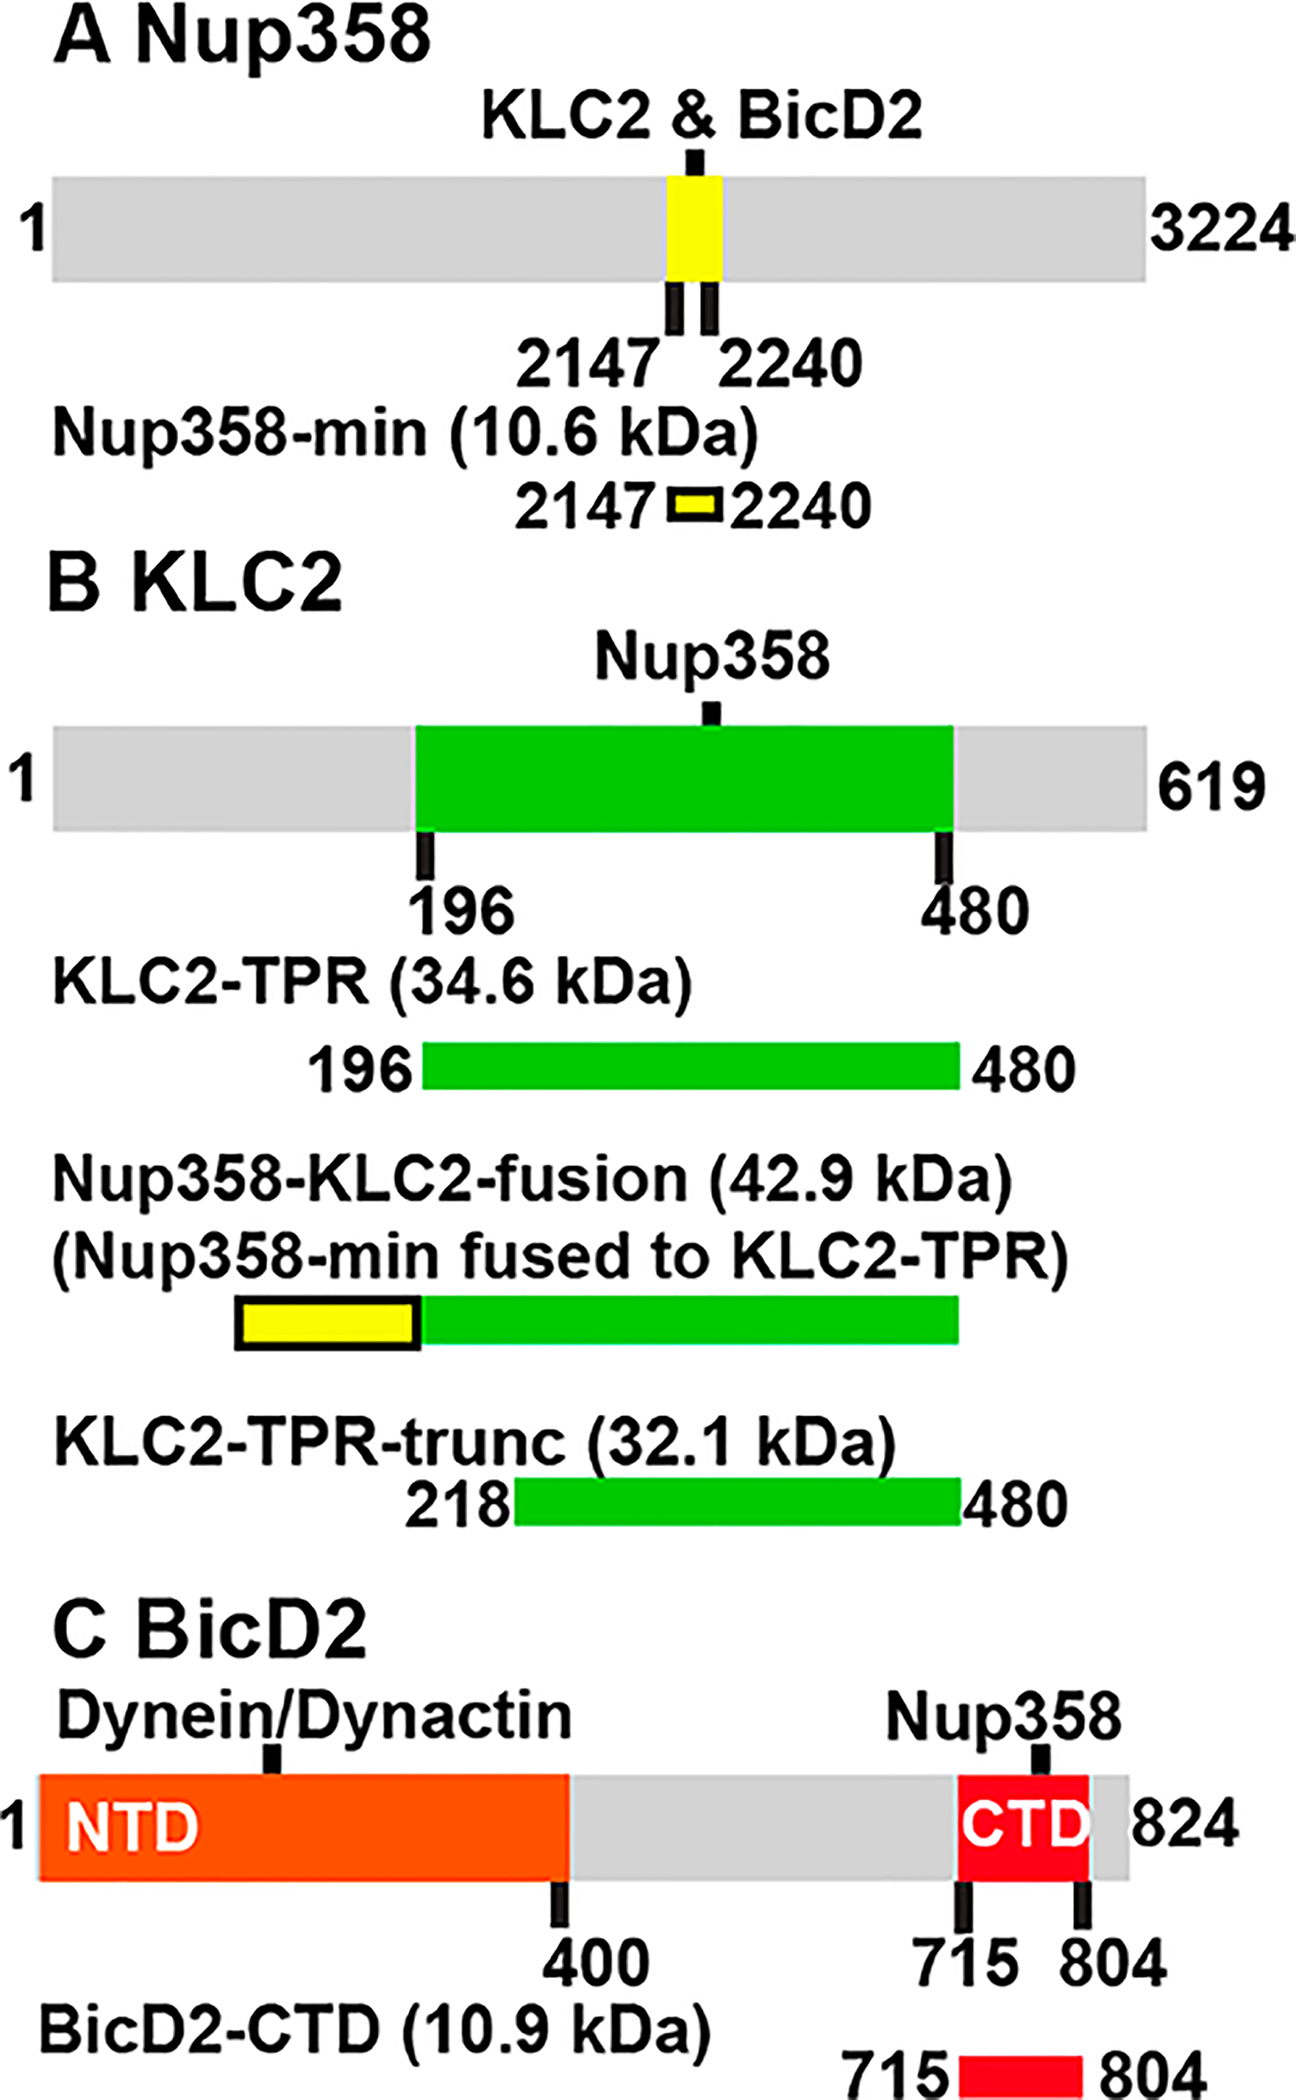
Figure 3.

Schematic representation of the full-length proteins Nup358, KLC2, and BicD2 (gray bars) with mapped protein–protein interaction sites (colored). Purified interacting domains and fusion proteins used in this study are shown as bars below the full-length proteins. Calculated molar masses (in kilodaltons) of the protein fragments are indicated: (A) Nup358-min (yellow), (B) KLC2TPR (green), the Nup358-KLC2-fusion protein, and KLC2TPR-trunc, and (C) BicD2-CTD (red).
