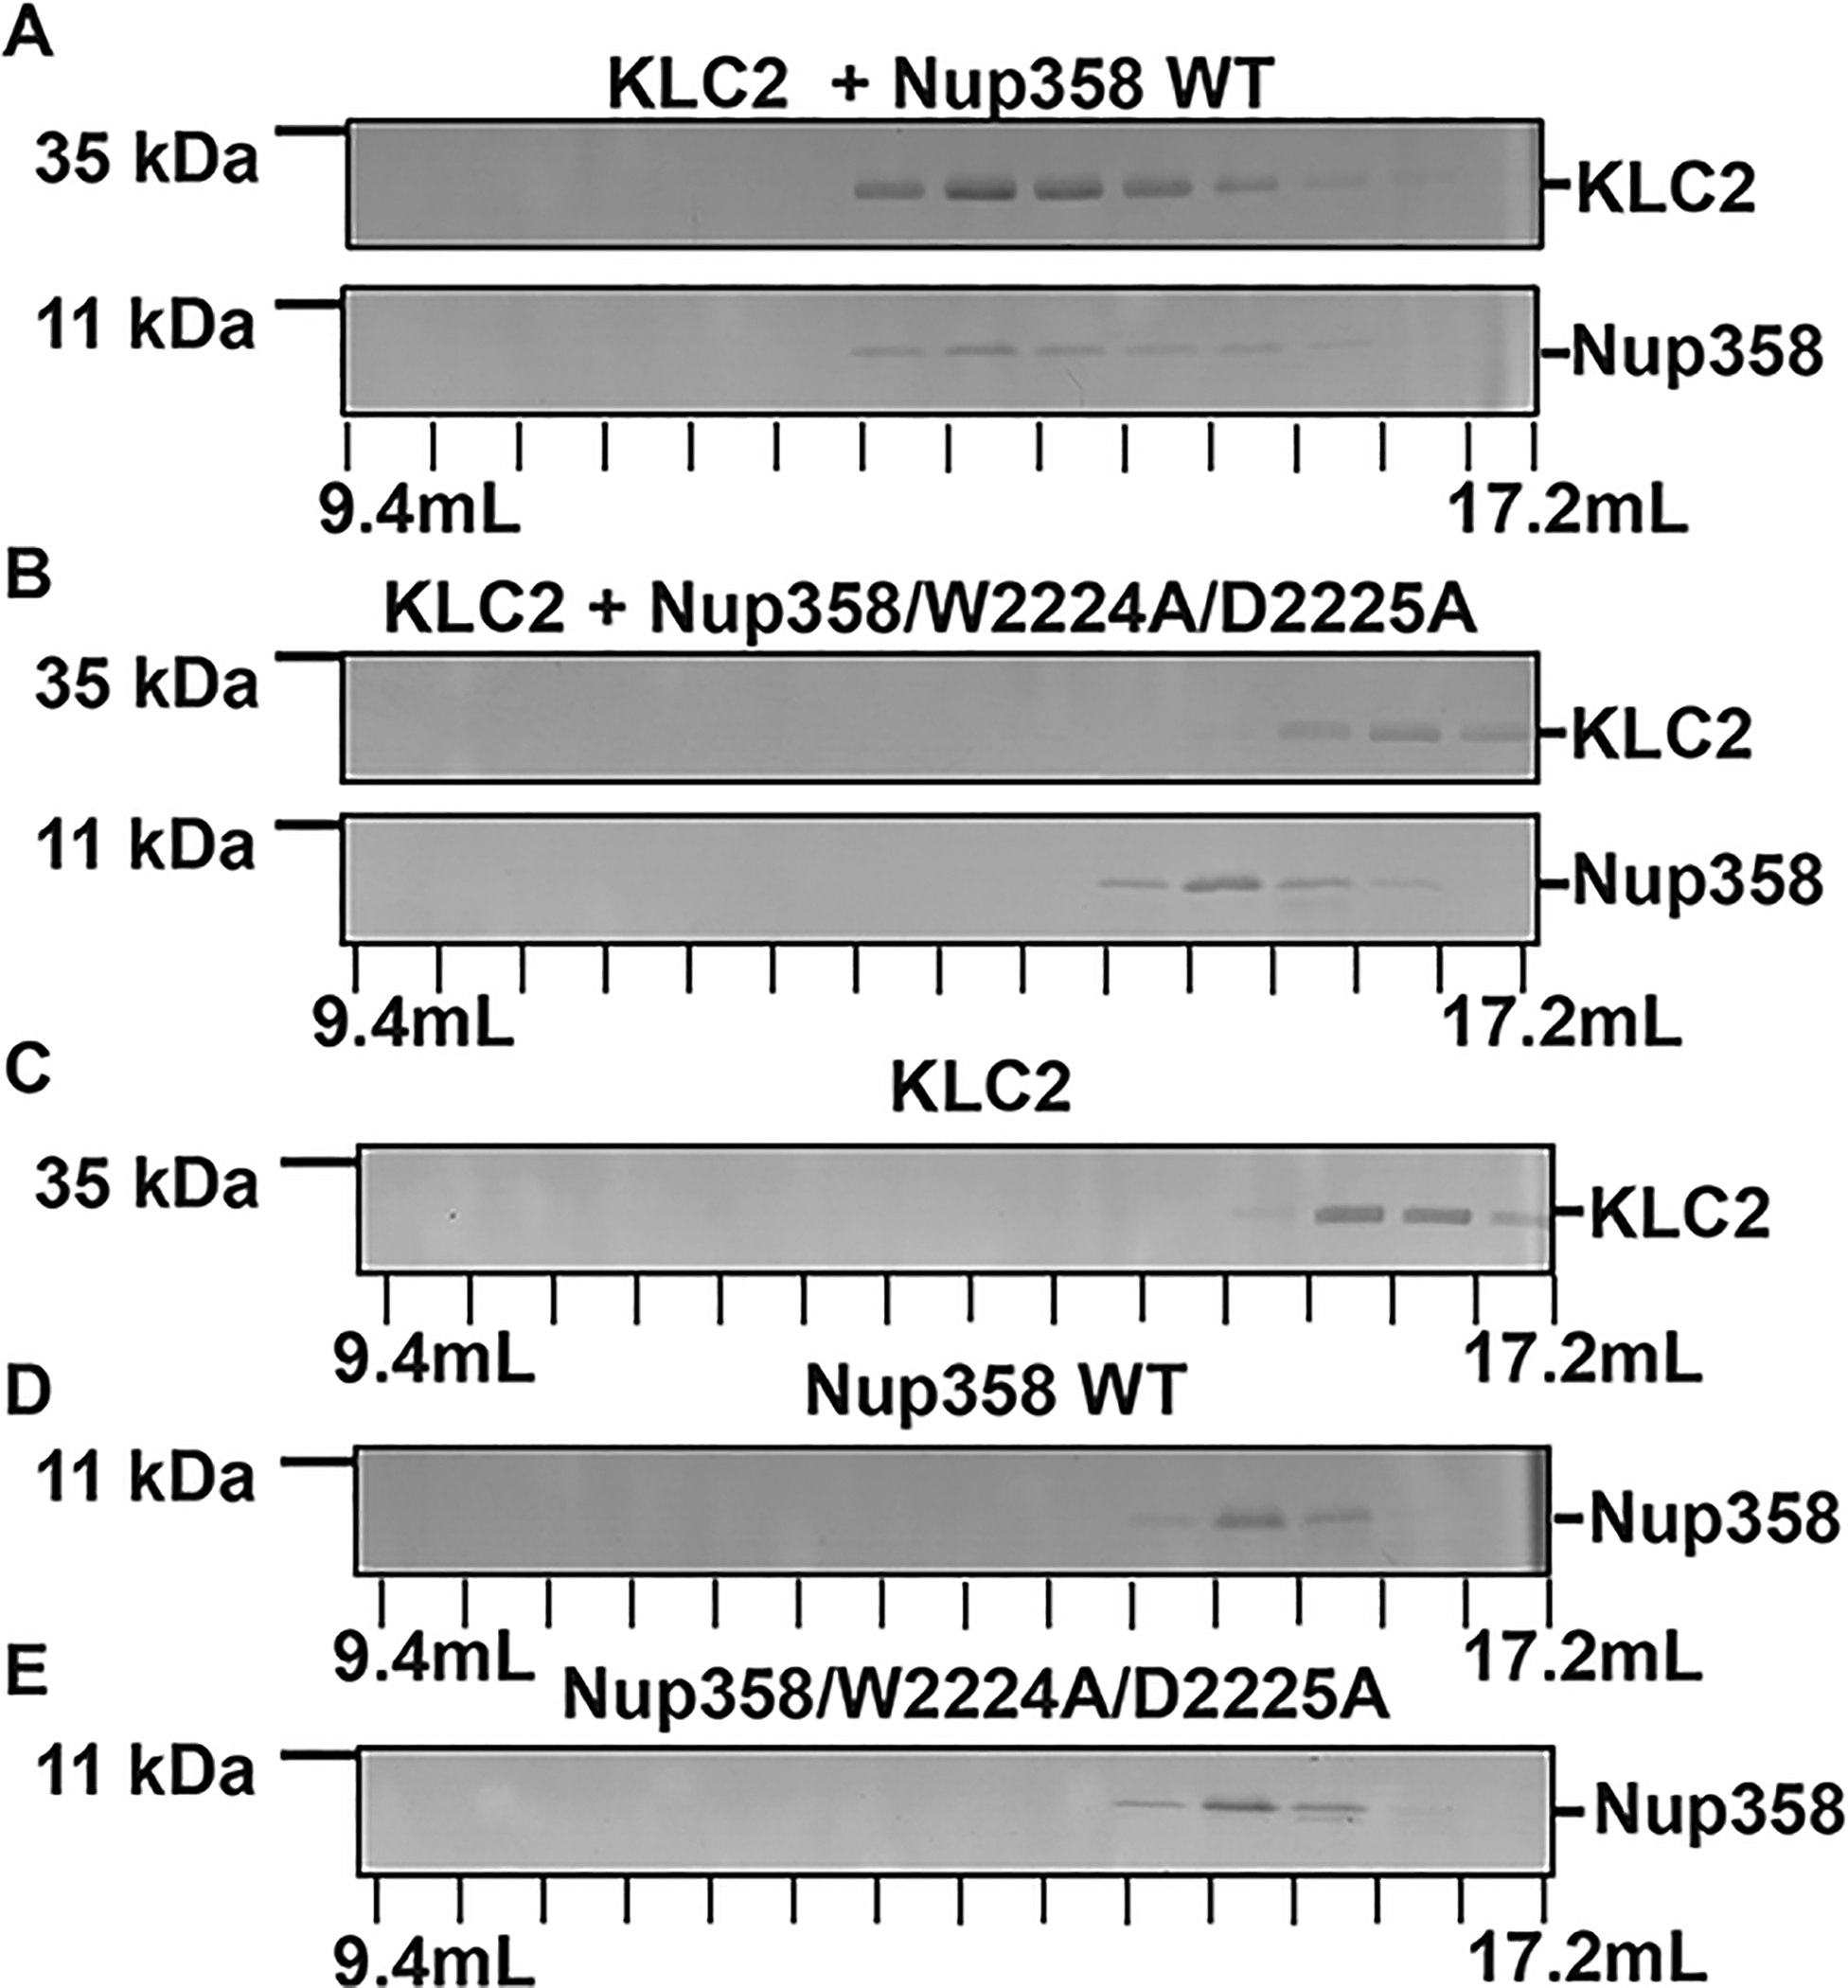
Figure 4.

Nup358-min interacts with KLC2 through its W-acidic motif. (A–E) To assess binding, purified proteins were combined (in a 1:1 molar ratio) and then separated by gel filtration chromatography. The elution fractions were analyzed using SDS–PAGE. The individual proteins were also analyzed. Elution volumes are indicated on the bottom; each tick mark represents an elution fraction with a volume of 0.6 mL. The molecular weights of standard proteins are denoted on the left. (A) KLC2TPR and Nup358-min, (B) KLC2TPR and Nup358-min/W2224A/D2225A mutant, (C) KLC2TPR, (D) Nup358-min, and (E) Nup358-min/W2224A/D2225A mutant. SDS–PAGE analyses of the purified proteins and the loaded samples are shown in Figures S3 and S4, respectively. The experiments were repeated, and very similar results were obtained. The numbers of replicates for experiments shown in each figure panel were (A) 4, (B) 2, (C) 3, (D) 4, and (E) 2.
