Figure 7.

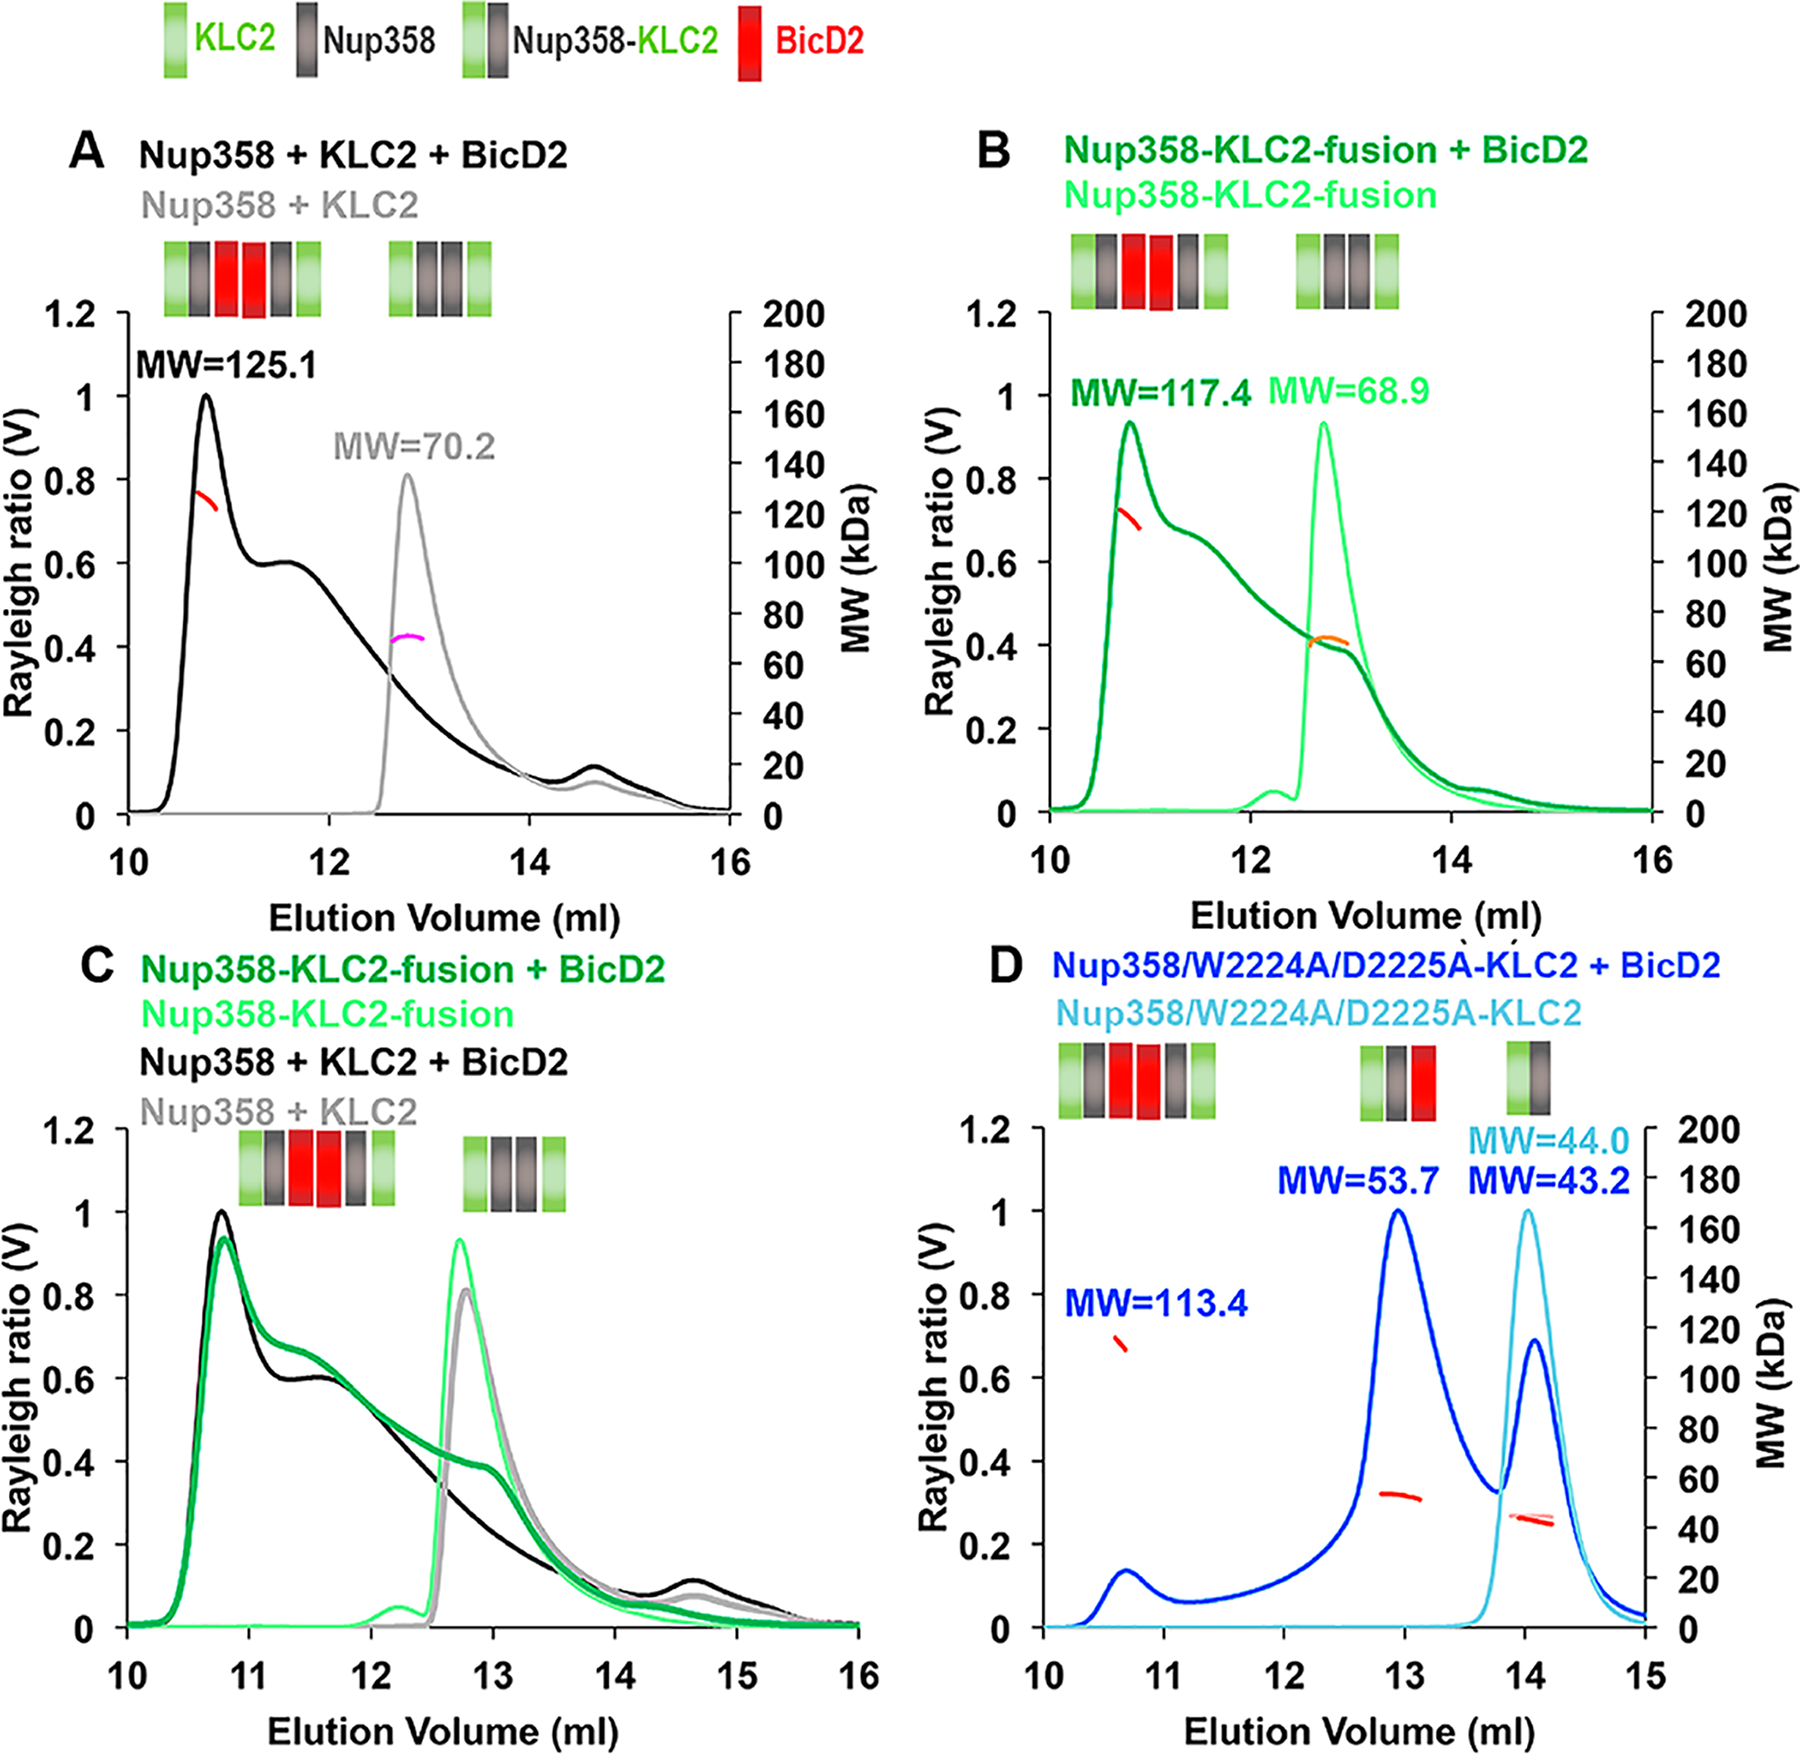
BicD2-CTD, Nup358-min, and KLC2TPR form a triple complex with a 2:2:2 stoichiometry. Purified proteins were analyzed by SEC–MALS. The Rayleigh ratio (distinct colors) and weight-averaged molar mass MW (in kilodaltons, colored in shades of red, orange, and pink) vs the elution volume are shown. MWs were averaged from two to three experiments (see Table S2 for errors and exact numbers of replicates) and are indicated. The oligomeric state that matches most closely to the data is indicated in a schematic manner above each elution peak; each Nup358-min, KLC2TPR, or BicD2-CTD protomer is represented by a gray, green, or red square, respectively. The same protein concentrations (4 mg/mL) were used for the Nup358-min/KLC2TPR complex (see Figure 5) as well as the Nup358-KLC2-fusion proteins (WT or W2224A/D2225A mutant). BicD2 was added at a fusion protein concentration of 1–4 mg/mL to achieve a 1:1 molar ratio of the reactants. The triple complex was assembled by mixing Nup358-min, KLC2TPR, and BicD2-CTD in an equimolar ratio, and the resulting triple complex was concentrated to 5 mg/mL before analysis. (A) Overlay of SEC–MALS elution profiles of Nup358-min and KLC2TPR (gray) and the Nup358-min/KLC2TPR/BicD2 triple complex (black). (B) Overlay of SEC–MALS elution profiles of the Nup358-KLC fusion protein and the Nup358-KLC fusion protein with BicD2-CTD. (C) Overlay of SEC–MALS elution profiles from panels A and B. (D) Overlay of SEC–MALS profiles of Nup358/W2224A/D2225A-KLC2-fusion protein and Nup358/W2224A/D2225A-KLC2-fusion protein with BicD2-CTD. Numbers of replicates for each experiment: (A) 3 and 3, (B) 3 and 3, (C) repeated from panels A and B, and (D) 2 and 2 (see Table S2).
