Figure 6.
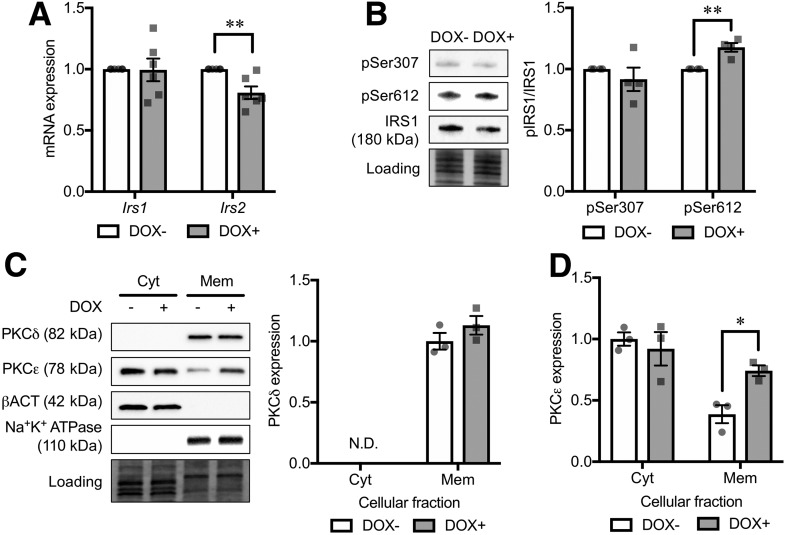
Analysis of background mechanism underlying IRS downregulation in CD36-overexpressing INS-1 cells. A: mRNA expression levels of Irs1 and Irs2. The expression levels were normalized to Ppia and Hprt. N = 6 for each group. B: Phosphorylation levels of IRS1 Ser307 (pSer307) and Ser612 (pSer612). Phosphorylated protein levels were normalized to the total protein levels. N = 4 for each group. Western blot analysis of cytoplasmic (Cyt) and membrane (Mem) protein levels of PKCδ (C) and PKCε (D). N = 3 for each group. The total protein images obtained using the Stain-Free technology are shown as a loading control (Loading). DOX− and DOX+ represent INS-1 cells without and with doxycycline-induced CD36 overexpression, respectively. The P values were determined by Student two-tailed t test (unpaired). *P < 0.05; **P < 0.01. N.D., not determined.

