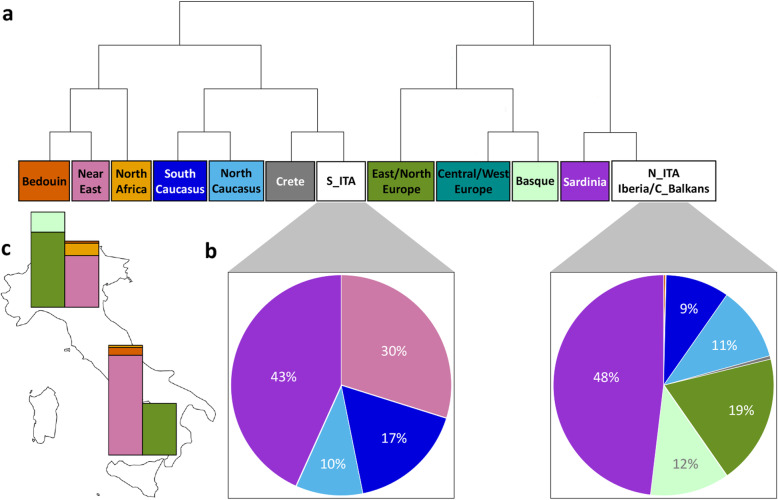
Fig. 1.
Clustering analysis and inference of admixture proportions performed on the “high-density Euro-Mediterranean dataset”. a fineSTRUCTURE hierarchical clustering reporting population clusters defined by collapsing branches of the obtained dendrogram that split with a posterior probability lower than 80%. N_ITA formed a cluster with Iberians and continental Balkan individuals from Bulgaria and Albania (C_Balkans). b Percentages of chromosome chunks shared between Italian and Euro-Mediterranean population clusters obtained with CHROMOPAINTER. Painting profiles showed in the pie charts are color-coded according to the palette used for fineSTRUCTURE clusters. c Ancestry proportions of the Italian population clusters inferred with the GLOBETROTTER pipeline from CHROMOPAINTER outputs. For each cluster, the bar on the left represents the major source of admixture, while the bar on the right represents the minor one. For details on the different subcomponents of these admixture sources, see Additional file 1: Table S1. To infer potentially different mixing proportions of N_ITA e S_ITA groups with respect to the other identified population clusters, all Euro-Mediterranean individuals were considered as recipients, while the two Italian groups were excluded from the donors. Admixture proportions showed in the bar charts are color-coded according to the palette used for the fineSTRUCTURE clusters

