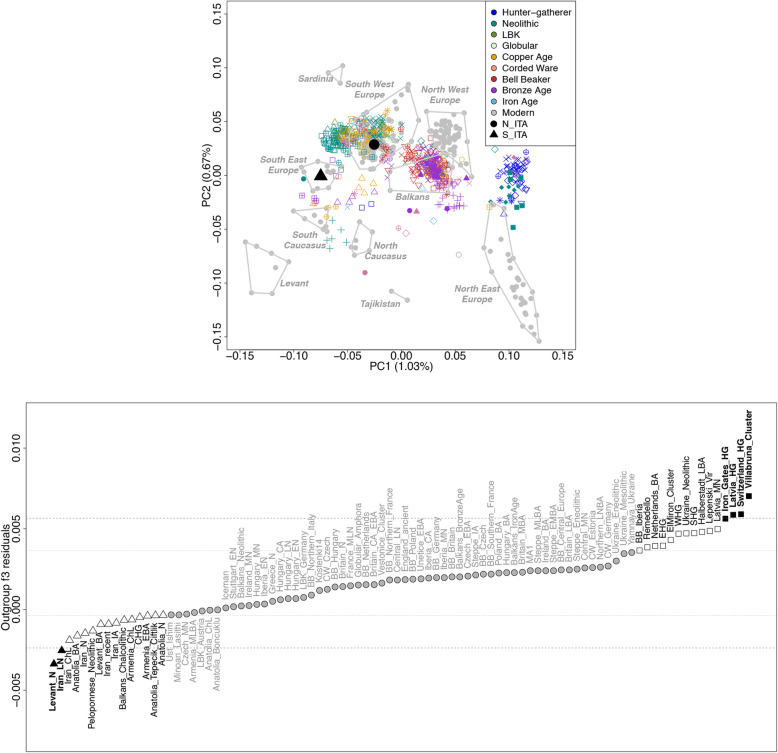
Fig. 2.
PCA and outgroup f3 analysis performed on the “modern + aDNA dataset”. a PCA projecting variation of 559 ancient samples onto the genetic space defined by 239 individuals belonging to 40 modern Euro-Mediterranean populations. Modern samples are reported as gray dots, with the exception of centroids calculated for the N_ITA and S_ITA clusters (black dot and black triangle, respectively), while the main ancient groups are color-coded according to their temporal/cultural framework. For details on the populations of origin of ancient samples, see the legends in Additional file 1: Figure S3. b Distribution of outgroup f3 residuals between N_ITA and S_ITA clusters. Residuals were calculated as the difference in outgroup f3 scores computed in the form f3 (Han Chinese (CHB); X Italian population cluster, X ancient population cluster) to test in turn the N_ITA and S_ITA clusters against each ancient population group (reported on the x-axis). Residuals are reported from the most negative (i.e., suggesting closer affinity of ancient populations to S_ITA) to the most positive one (i.e., suggesting closer affinity of ancient populations to N_ITA); those exceeding one or two standard deviations (SDs) (indicated by dashed lines) from the mean of the obtained distribution are color-coded in white and black squares for N_ITA and in white and black triangles for S_ITA, respectively

