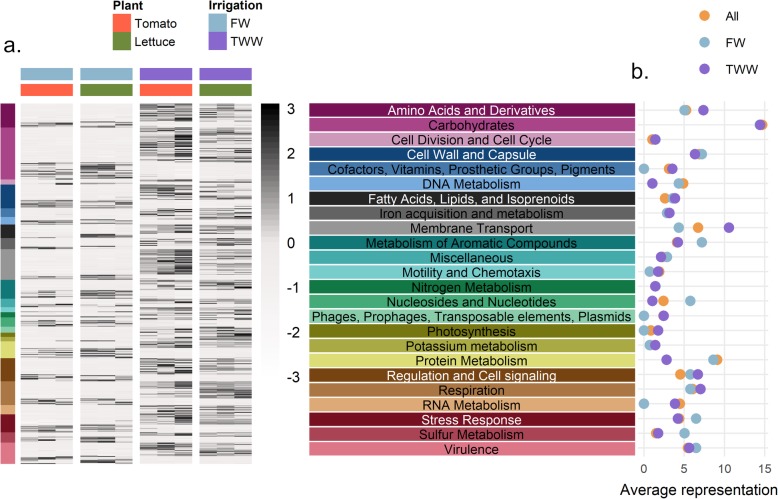
Fig. 3.
Genetic profile of the 438 significantly differentially abundant microbial genes between irrigation treatments. a Heatmap of genes enriched or depleted (FDR p < 0.01) in the metagenomes of TWW-irrigated roots (displaying trimmed mean of M values TMM). Gene abundance was normalized by scaling each row separately. The gene list was clustered to high hierarchy SEED categories. b The proportion of genes enriched or depleted in TWW-irrigated root metagenomes compared to the total abundance of that category in all metagenome analyses. Enriched category (TWW, magenta), deprived (FW, light blue), or the proportion within the full gene catalogue (marked as “all”, colored by orange), are highlighted. The proportion was calculated based on the number of genes assigned to the different categories with-in each data set

