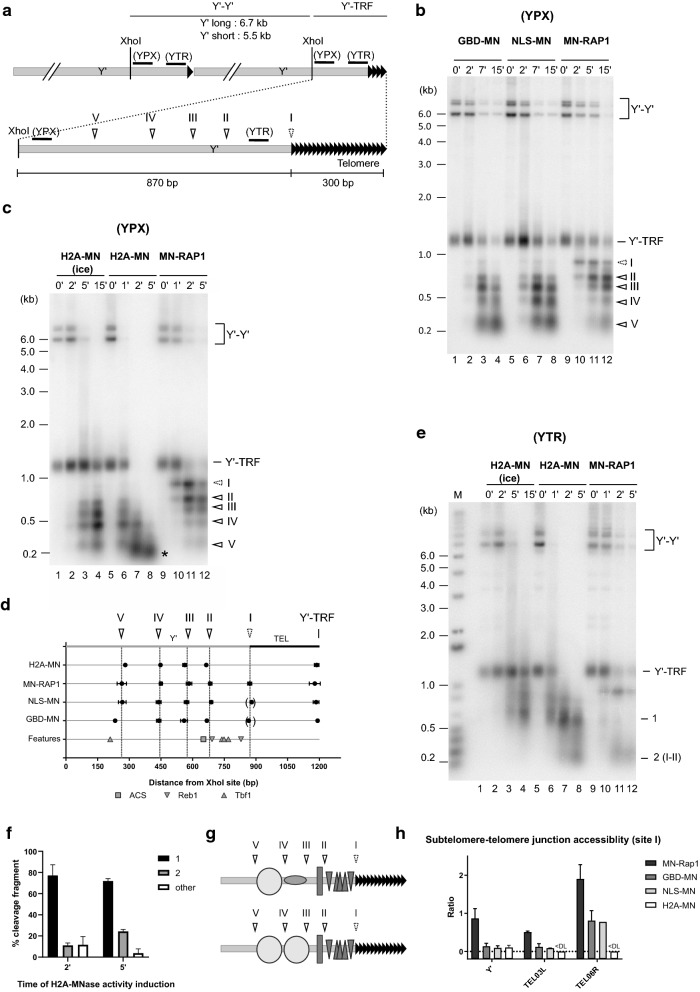
Fig. 1.
Chromatin organization of Y’ elements. a Schematic drawing of Y’ elements with position of the conserved XhoI site. Y’-specific probes (YPX, YTR) are indicated by a solid black line. TRF: Terminal Restriction Fragment. Distal black triangles represent terminal repeat sequences. MNase-fused protein-induced cutting on terminal fragments (Y’-TRF), as derived from b is indicated by arrowheads. Solid line arrowheads show observable cutting common to all MNase-fused proteins, whereas the dotted line arrowhead corresponds to cutting mainly observable with MN-RAP1. b In vivo ChEC experiments with GBD-MN (W3749-1a + pRSE), NLS-MN (W3749-1a + pG1NLS2), and MN-RAP1 (EPY007) as analyzed on Y’ elements. Southern blot with XhoI-digested genomic DNA hybridized to the YPX Y’-specific probe. Time of MNase activity in minutes is indicated on top of gel. Arrowheads as in a. DNA marker sizes are indicated on left of gel (kb). c In vivo ChEC experiments with H2A-MN (EPY130) and MN-RAP1 (EPY007) analyzed at Y’ elements. Gel annotations as in b. *: end-point mono-nucleosomal fragment (see Additional File 1: Fig. S1c). d Location of MNase-sensitive sites on Y’-TRF with known features indicated. Averaged fragment sizes ± standard deviation of MNase-induced cutting determined from at least 2 independent experiments are plotted with respect to the XhoI site. Location of features (Y’ element, ACS, and Tbf1 and Reb1 binding sites) from a representative Y’-TRF sequence, TEL08L, is included. Parentheses around cutting sites indicate extremely low cutting efficiency that could not be quantified consistently. e In vivo ChEC experiments with H2A-MN (EPY130), and MN-RAP1 (EPY007) analyzed at Y’ elements. The blot shown in d was re-hybridized with the more distal YTR Y’-specific probe that encompasses Tbf1- and Reb1-binding sites (see a). M: DNA size marker. f Quantification of the fraction of fragments 1 and 2 (see gel in e) generated by H2A-MNase (30 °C). Average percent ± standard deviation from 2 independent ChEC experiments is plotted. g Model of chromatin organization of Y’ terminal fragments. Nucleosomes are depicted by circles, the ORC complex by a rectangle and Tbf1/Reb1 proteins by triangles. h Accessibility of Y’-telomere junctions and X-telomere junctions to MNase-fused proteins. Ratio of cleavage products detected at the Y’-junction (% signal from band I) on cleavage products detected around Y’-ACS (% signal from band II and III) for each MNase-fused protein. Ratio of cleavage products detected at the X-junction (% signal from band I) on cleavage products detected around X-ACS (% signal from band V and VI for X(03L)-telomere, and from band III for X(06R)-telomere for each MN-fused protein. DL: Detection Limit

