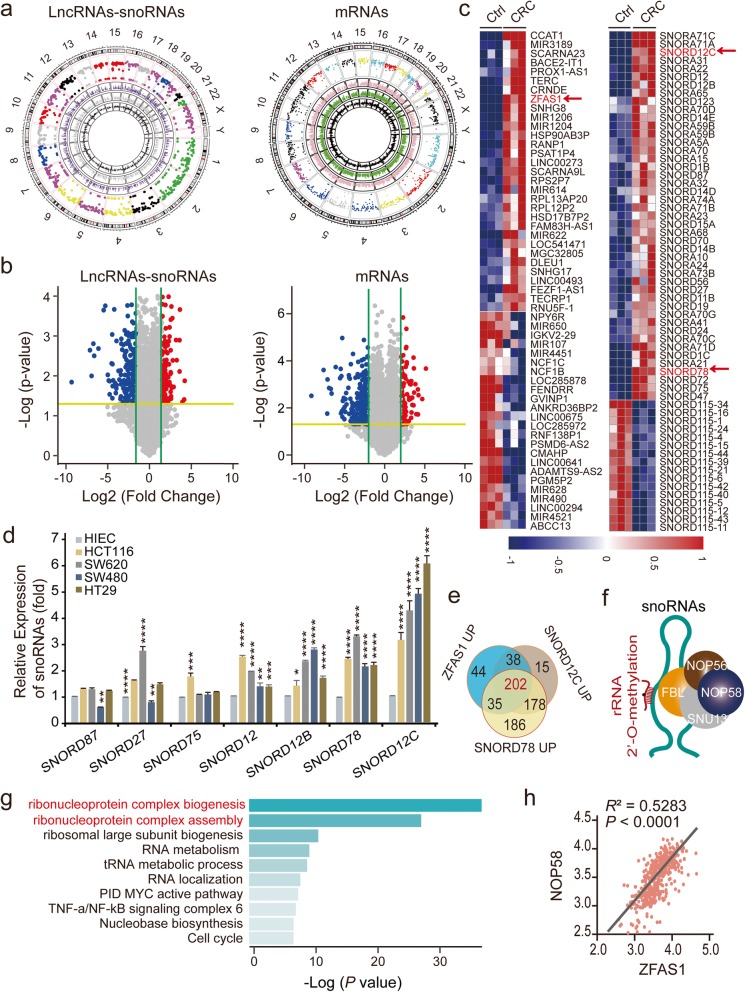
Fig. 1.
The correlation between ZFAS1, SNORD12C and SNORD78 expression in CRC paired tissues and TCGA. a, A circular diagrams from the most inner circle to the most outer circle represent the log2 fold change value of down-regulated or up-regulated differentially expressed LncRNAs, snoRNAs, and mRNAs of the CRC compared with matched adjacent-tumor control tissues (n = 3, P < 0.05), the gene expression value of matched adjacent-tumor control tissues, the gene expression value of CRC, the different chromosome location of the genes in different colors, and the ruler of chromosome. b, The volcano plot of LncRNAs, snoRNAs, and mRNAs expression among included 3 pairs of CRC tissues and adjacent-tumor control tissues (n = 3, Log 2 FC = 2.0, P < 0.05). c, Hierarchical cluster heat map illustrating the most differentially expressed LncRNAs and snoRNAs in CRC and corresponding paired adjacent-tumor control tissues, selected top 30 up-regulated or down-regulated genes (n = 3, P < 0.05). Red in heat map denotes upregulation. Blue denotes downregulation. d, The expression levels of screened snoRNAs in normal intestinal epithelial HIEC cell and CRC cells including HCT116, SW620, SW480, and HT29 detected by qRT-PCR assays. Values are the mean ± s.d. of n = 3 independent experiments. e, The Venn plot showing the co-expression genes of ZFAS1, SNORD12C and SNORD78 in CRC microarray enrichments (n = 3) in our CRC cohort. f, The schematic diagram of 2′-O-methylation of ribosomal RNA catalyzed by C/D box snoRNP complexes. g, GO pathways enrichment analysis of the up-regulated co-expression genes of ZFAS1, SNORD12C and SNORD78, and the related biological functions. h, The linear correlation analysis representing the relation of NOP58 expression levels with ZFAS1 upon TCGA CRC database. *, P < 0.05; **, P < 0.01; ***, P < 0.001; ****, P < 0.0001

