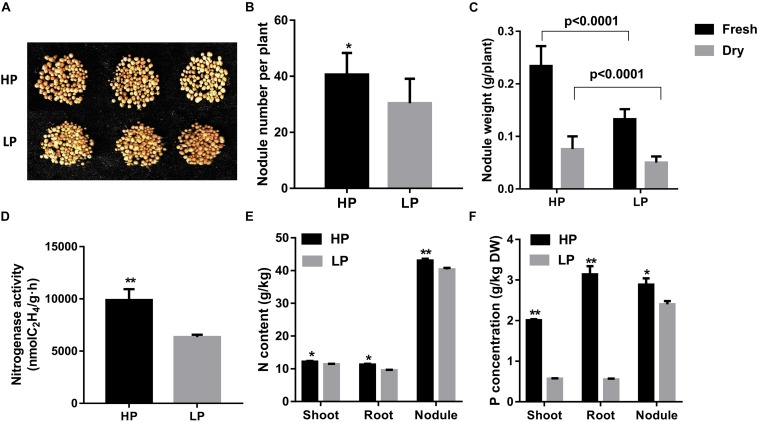
FIGURE 1.
Nodulation parameter analysis of soybean plant nodules treated by different P levels. (A) Photographs of plant nodule growth performance. (B) Nodule number. (C) Nodule total weight per plant. (D) Nitrogenase activities of nodules measured by acetylene reduction assay. (E) Nodule N content. (F) Nodule P content. Soybean plant samples were harvested 28 days after inoculation with rhizobium watered with nitrogen-free nutrient solution. Data are presented as the average of three different biological replicates and 20 plants for each replicate. Bars show the means ± SD values. Asterisks indicate significant difference within a P level in t-tests. *p < 0.05, **p < 0.01.

