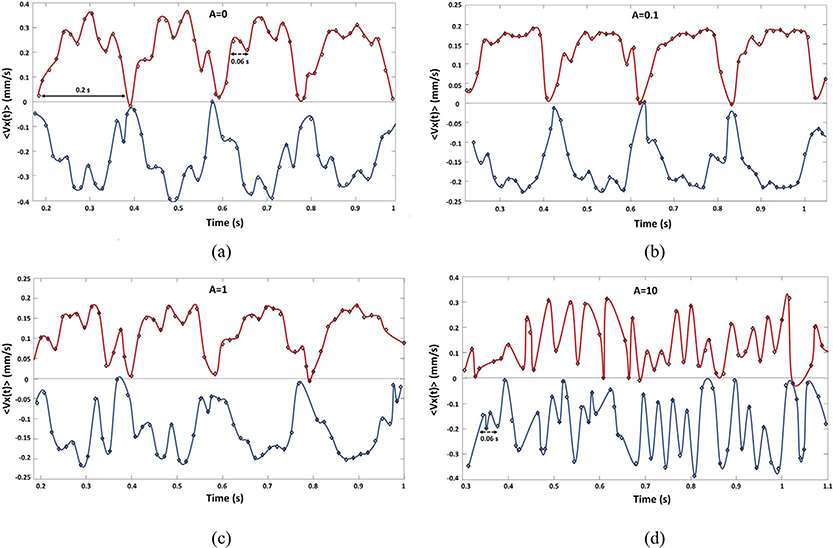
Fig. 11.
The signals (〈VxL〉, 〈VxR〉) are plotted respectively in red and blue lines in a time window including two periods of 0.2 s. The arrows evidence the significant periods: solid arrow T = 0.2 s, dotted arrow T = 0.06 s. (a) A = {0}. (b) A = {0.1}. (c) A = {1}. (d) A = {10}. (For interpretation of the references to color in this figure legend, the reader is referred to the web version of this article.)

