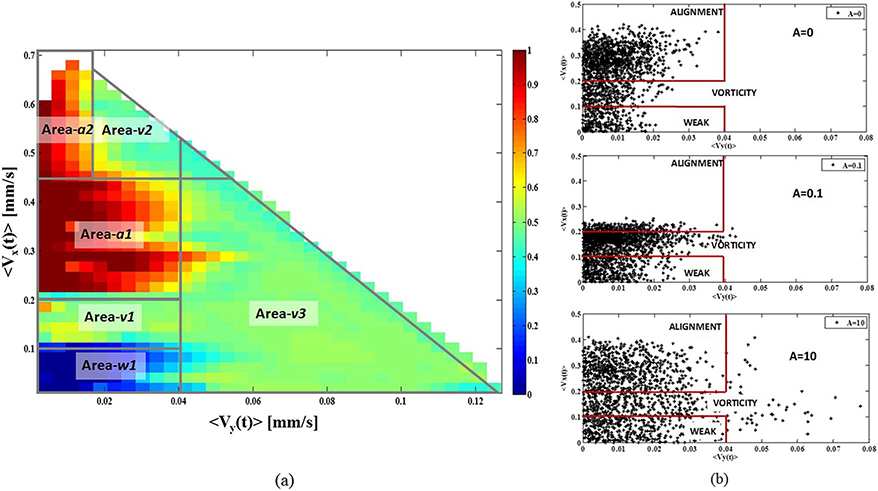
Fig. 4.
(a) The map that establishes the relation between the RBCs flow patterns and the RBCs velocities along the horizontal (|〈Vx(t)〉|) and vertical (|〈Vy(t)〉|). The x-axis and the y-axis report respectively the |〈Vy(t)〉| and the |〈Vx(t)〉| values in [mm/s], whereas the color codes the behaviors: “0” for the Weak Activity, “0.5” for the Vorticity and “1” for the Alignment. (b) The three scattering plots related to (|〈Vy(t)〉|, |〈Vx(t)〉|) for the experiments A ∈{0; 0.1; 10}. All these experiments reach the Alignment.

