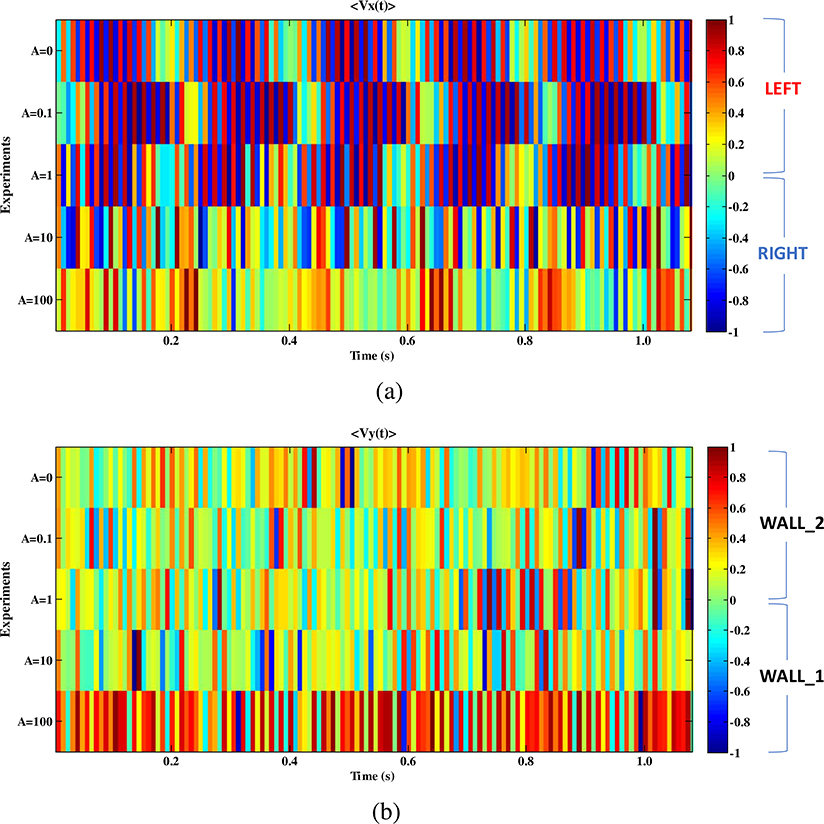
Fig. 6.
The velocities signals (〈Vx(t)〉, 〈Vy(t)〉) for all the five experiments A ∈{0; 0.1; 1; 10; 100} obtained by a spatial averaging the relative matrices (〈Vx(t)〉, 〈Vy(t)〉) and plotted using a color-coded representation in a time window of 1 s. The signals (〈Vx(t)〉, 〈Vy(t)〉) were normalized in the range [−1; 1]. (a) Comparison of 〈Vx(t)〉 trends: particles displacements toward the left direction for positive values (red arrow) and the right direction for negative values (blue arrow). (b) Comparison of 〈Vy(t)〉 trends: the positive values are for movements toward the wall_2 (down), and the negative for movements toward the wall_1 (up). (For interpretation of the references to color in this figure legend, the reader is referred to the web version of this article.)

