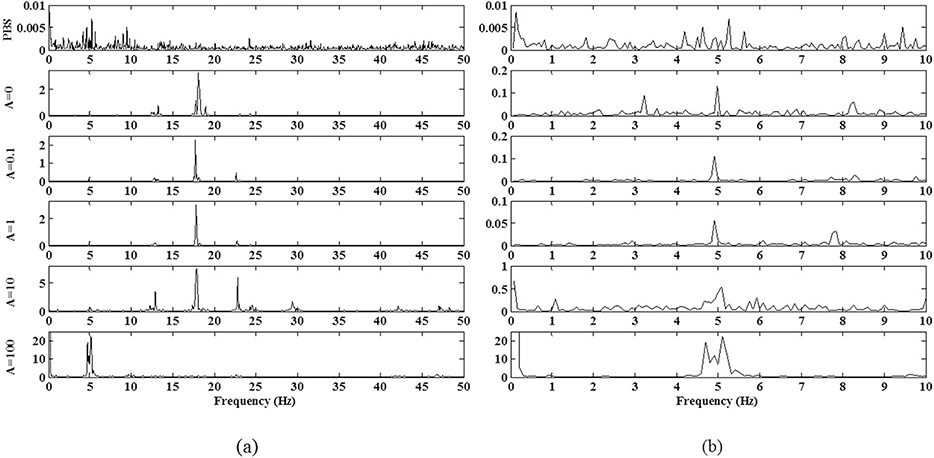
Fig. 8.
The spectra of 〈Vx(t)〉 (a) for the PBS flow and the five experimental conditions A ∈ {0; 0.1; 1; 10; 100}. The frequencies components at f ∈{5; 17.5} Hz have been selected as the most significant being highly sensitive to the experimental conditions and at the same time dominant at least in one experiment. They correspond to the time periods respectively T ∈ {0.2; 0.06} s. (b) A zoom of the spectra in the range f ∈[0.08; 10] Hz.

