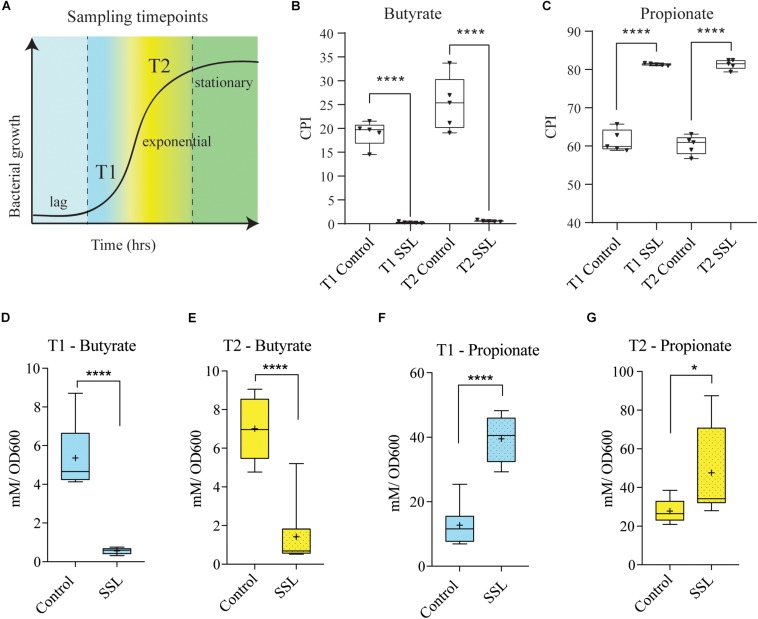
FIGURE 5.
SSL reduces the capacity of the bacterial culture to produce butyrate. (A) Schematic of experimental design. Sampling timepoint T1 and T2 represents early log phase and the end of exponential phase, respectively, in cultures of fecal bacteria in CDM. (B) Community phenotype index (CPI) shows the percentage of bacterial community members that encoded complete butyrate pathways, predict that control cultures at both timepoints produce significantly more butyrate (20%, 25% butyrate producers) than the SSL-treated cultures (<1% of butyrate producers). (C) CPI showing the percentage of bacterial community members that encode complete propionate pathways, predict that SSL-treated cultures (>80%) at both timepoints produce significantly more propionate than controls (∼60%). (D,E) Butyrate production as measured by GC-MS was significantly higher in control cultures compared to SSL-treated cultures at both T1 and T2. (F,G) Propionate production as measured by GC-MS was significantly lower concentration in control cultures relative to SSL-treated cultures at both T1 and T2. Bacterial culture experiments and SCFA analysis: n = 9–10, two biological replicates. Statistical significance of pairwise comparisons was determined with a two-tailed Student’s t-test, using Graph Pad Prism *<0.05, **<0.01, ***<0.001, ****<0.0001.

