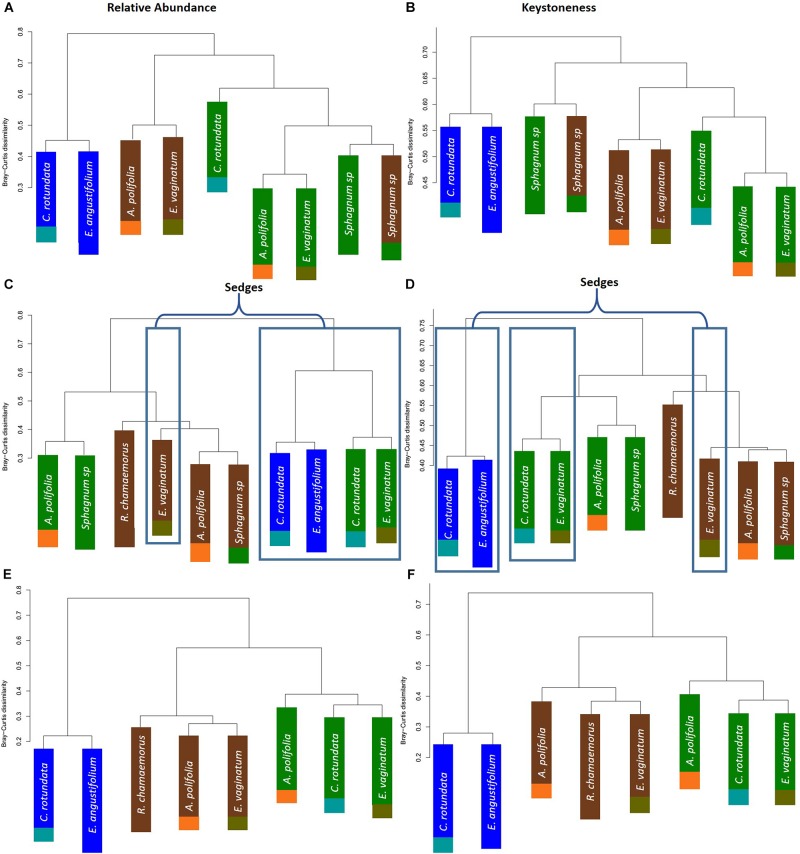
FIGURE 7.
Hierarchical clustering of Bray–Curtis dissimilarity between community networks weighting organisms by (A,C,E) relative abundance for a given habitat/plant and (B,D,F) relative importance for a given habitat/plant. Main colors correspond to habitat with brown = palsa, green = bog, blue = fen. Accent colors represent plant species with orange = A. polifolia, brown = R. chamaemorus, olive = E. vaginatum, dark green = Sphagnum, teal = C. rotundata, dark blue = E. angustifolium.

