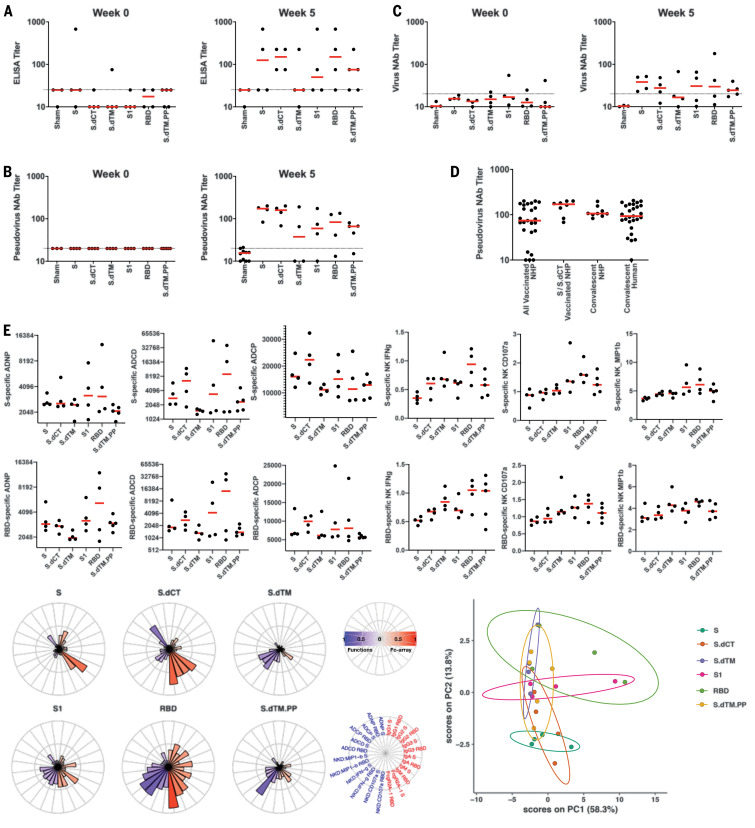
Fig. 2. Humoral immune responses in vaccinated rhesus macaques.
(A to C) Humoral immune responses were assessed after immunization by (A) binding antibody ELISA, (B) pseudovirus neutralization assays, and (C) live virus neutralization assays. (D) Comparison of pseudovirus neutralization titers in vaccinated macaques (all animals as well as the S and S.dCT groups), a cohort of 9 convalescent macaques, and a cohort of 27 convalescent humans from Boston, United States, who had recovered from SARS-CoV-2 infection. NHP, nonhuman primates. (E) S- and RBD-specific antibody-dependent neutrophil phagocytosis (ADNP), antibody-dependent complement deposition (ADCD), antibody-dependent monocyte cellular phagocytosis (ADCP), and antibody-dependent NK cell activation (IFN-γ secretion, CD107a degranulation, and MIP-1β expression) are shown. Radar plots show the distribution of antibody features across the vaccine groups. The size and color intensity of the wedges indicate the median of the feature for the corresponding group (blue depicts antibody functions; red depicts antibody isotype, subclass, and FcγR binding). The principal components analysis (PCA) plot shows the multivariate antibody profiles across groups. Each dot represents an animal, the color of the dot denotes the group, and the ellipses show the distribution of the groups as 70% confidence levels assuming a multivariate normal distribution. In the dot plots above, red bars reflect median responses, and dotted lines reflect assay limits of quantitation.

