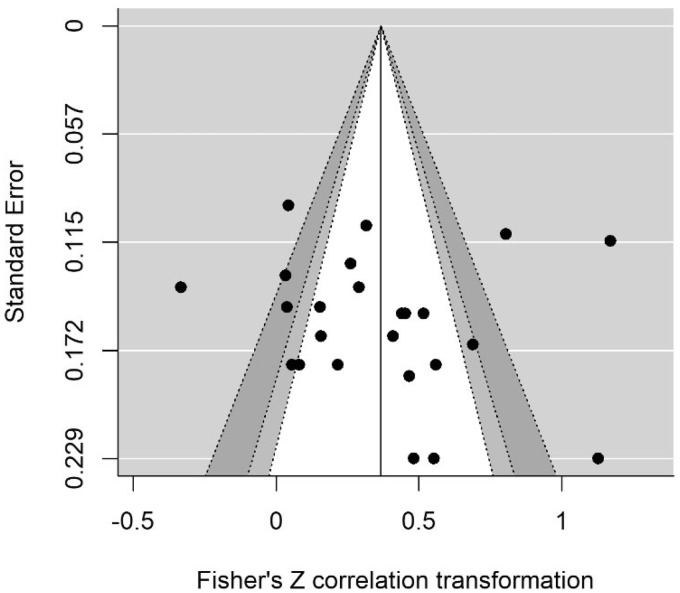
Figure 6.
Contour-Enhanced Funnel Plot for EF-rt Model. Individual study effect sizes are displayed on the x-axis, with their corresponding standard errors on the y-axis. The funnel lines are centered on the summary effect size, providing an indication of the spread. The unshaded region in the middle corresponds to p values greater than .10, the light gray shaded region corresponds to p values between .10 and .05, the dark gray region corresponds to p values between .05 and .01, and the region outside of the funnel corresponds to p values below .01.

