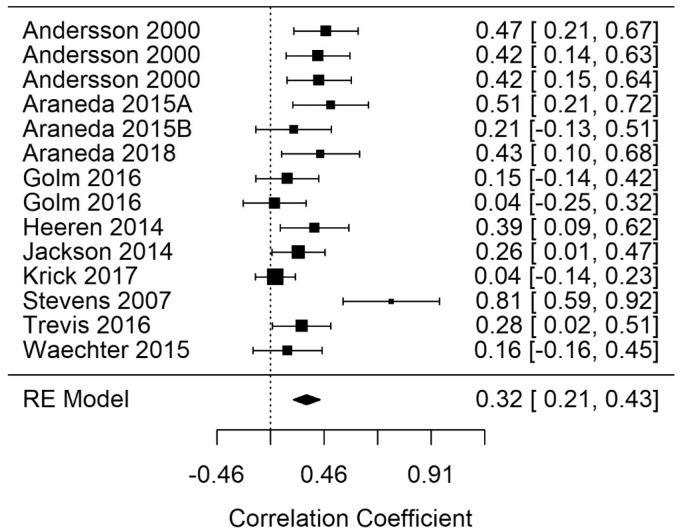
Figure 7.
Forest Plot Showing the Correlation Between Tinnitus and Response Times in Inhibition Tasks (Inhibition-rt). Each study is represented by a point estimate bounded by a 95% CI, with the area of each square proportional the study’s weight within the model. Summary effect size is displayed as a polygon at the bottom of the plot, with the width of the polygon representing the 95% CI. RE = Random-effects.

