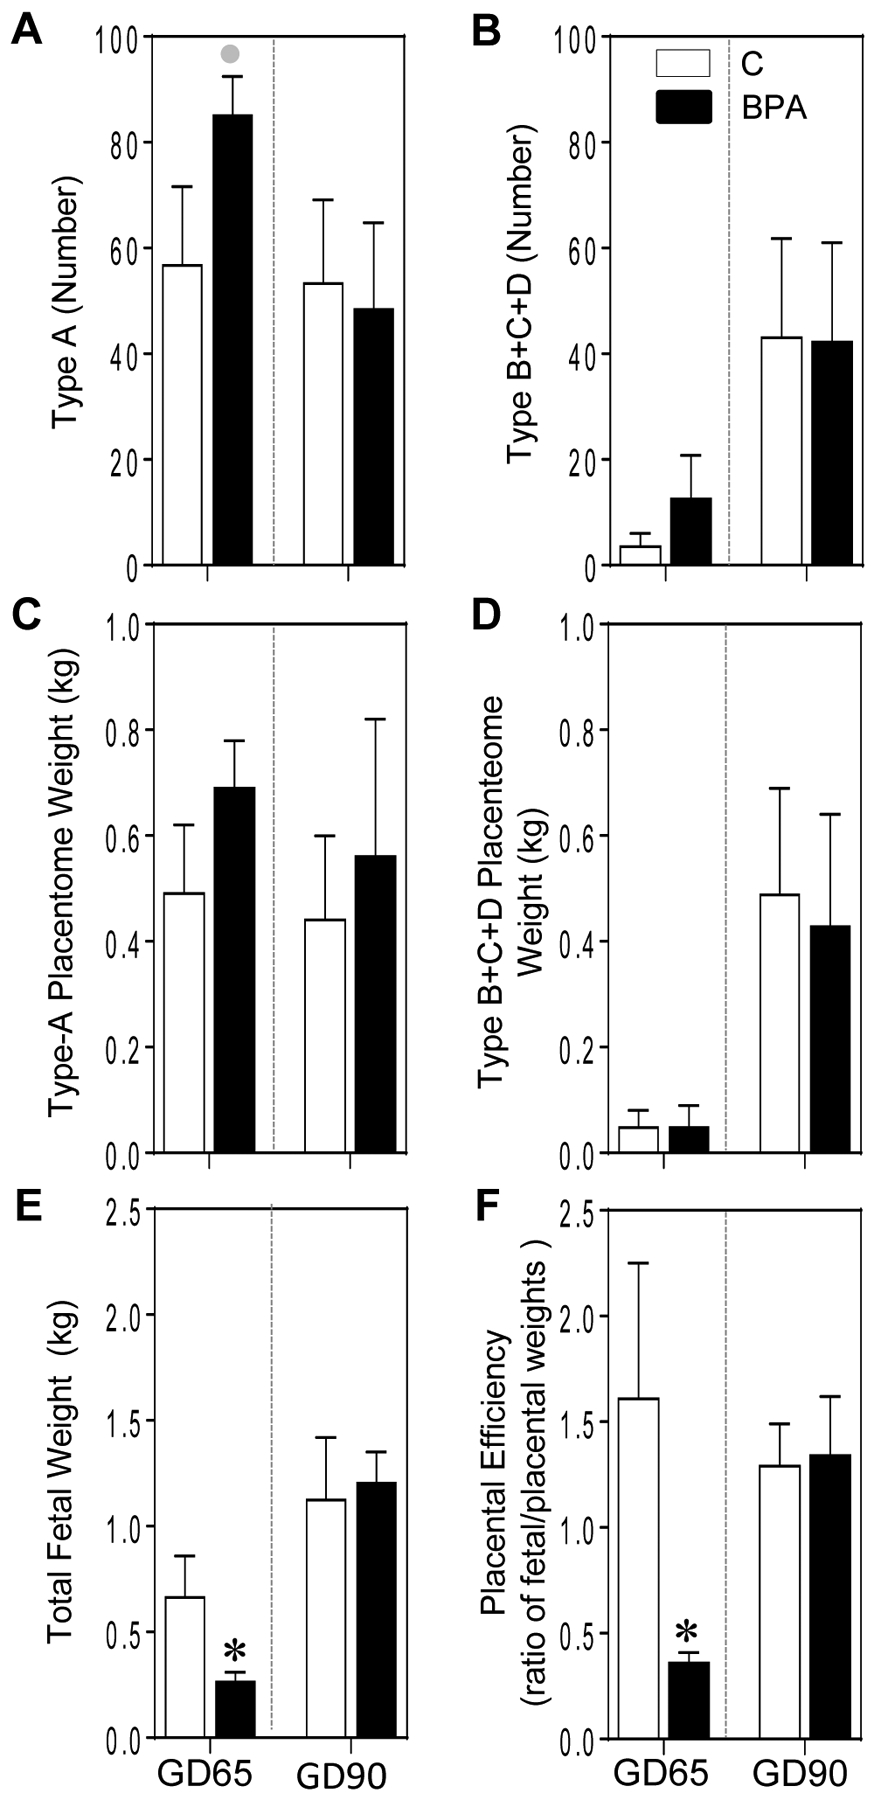
Figure 1:

Mean ± SEM of number (A and B) and weight (C and D) of type A and B+C+D placentomes, fetal weight (E) and placental efficiency (F) at GD65 and GD90 from control (C) and BPA-treated pregnant sheep are shown. * = p < 0.05 by Student’s t-test and grey circles indicate large effect size by Cohen’s effect size analysis.
