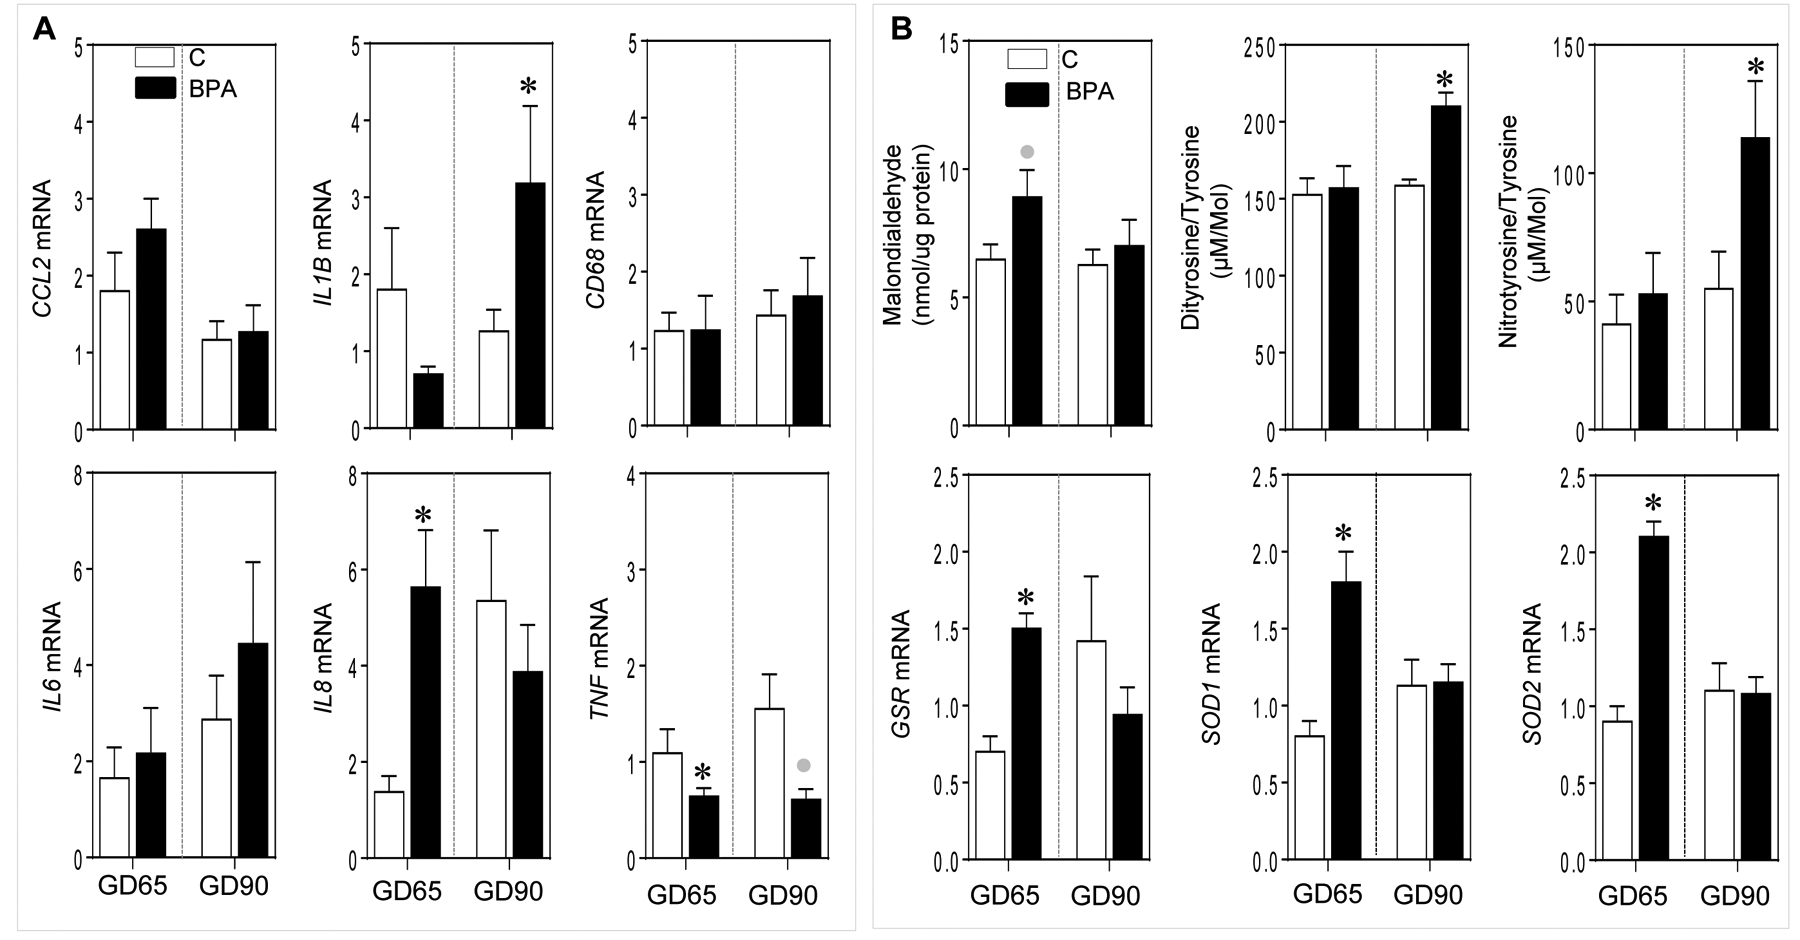
Figure 2:

Mean ± SEM of fold change in mRNA expression for inflammatory cytokine and macrophage marker genes (Panel A) and oxidative stress markers malondialdehyde, dityrosine and nitrotyrosine (Panel B, top) and fold change in mRNA expression of antioxidants genes (Panel B, bottom) at GD65 and GD90 from control (C) and BPA exposed pregnant sheep are shown. * = p < 0.05 by Student’s t-test and grey circles indicate large effect size by Cohen’s effect size analysis.
