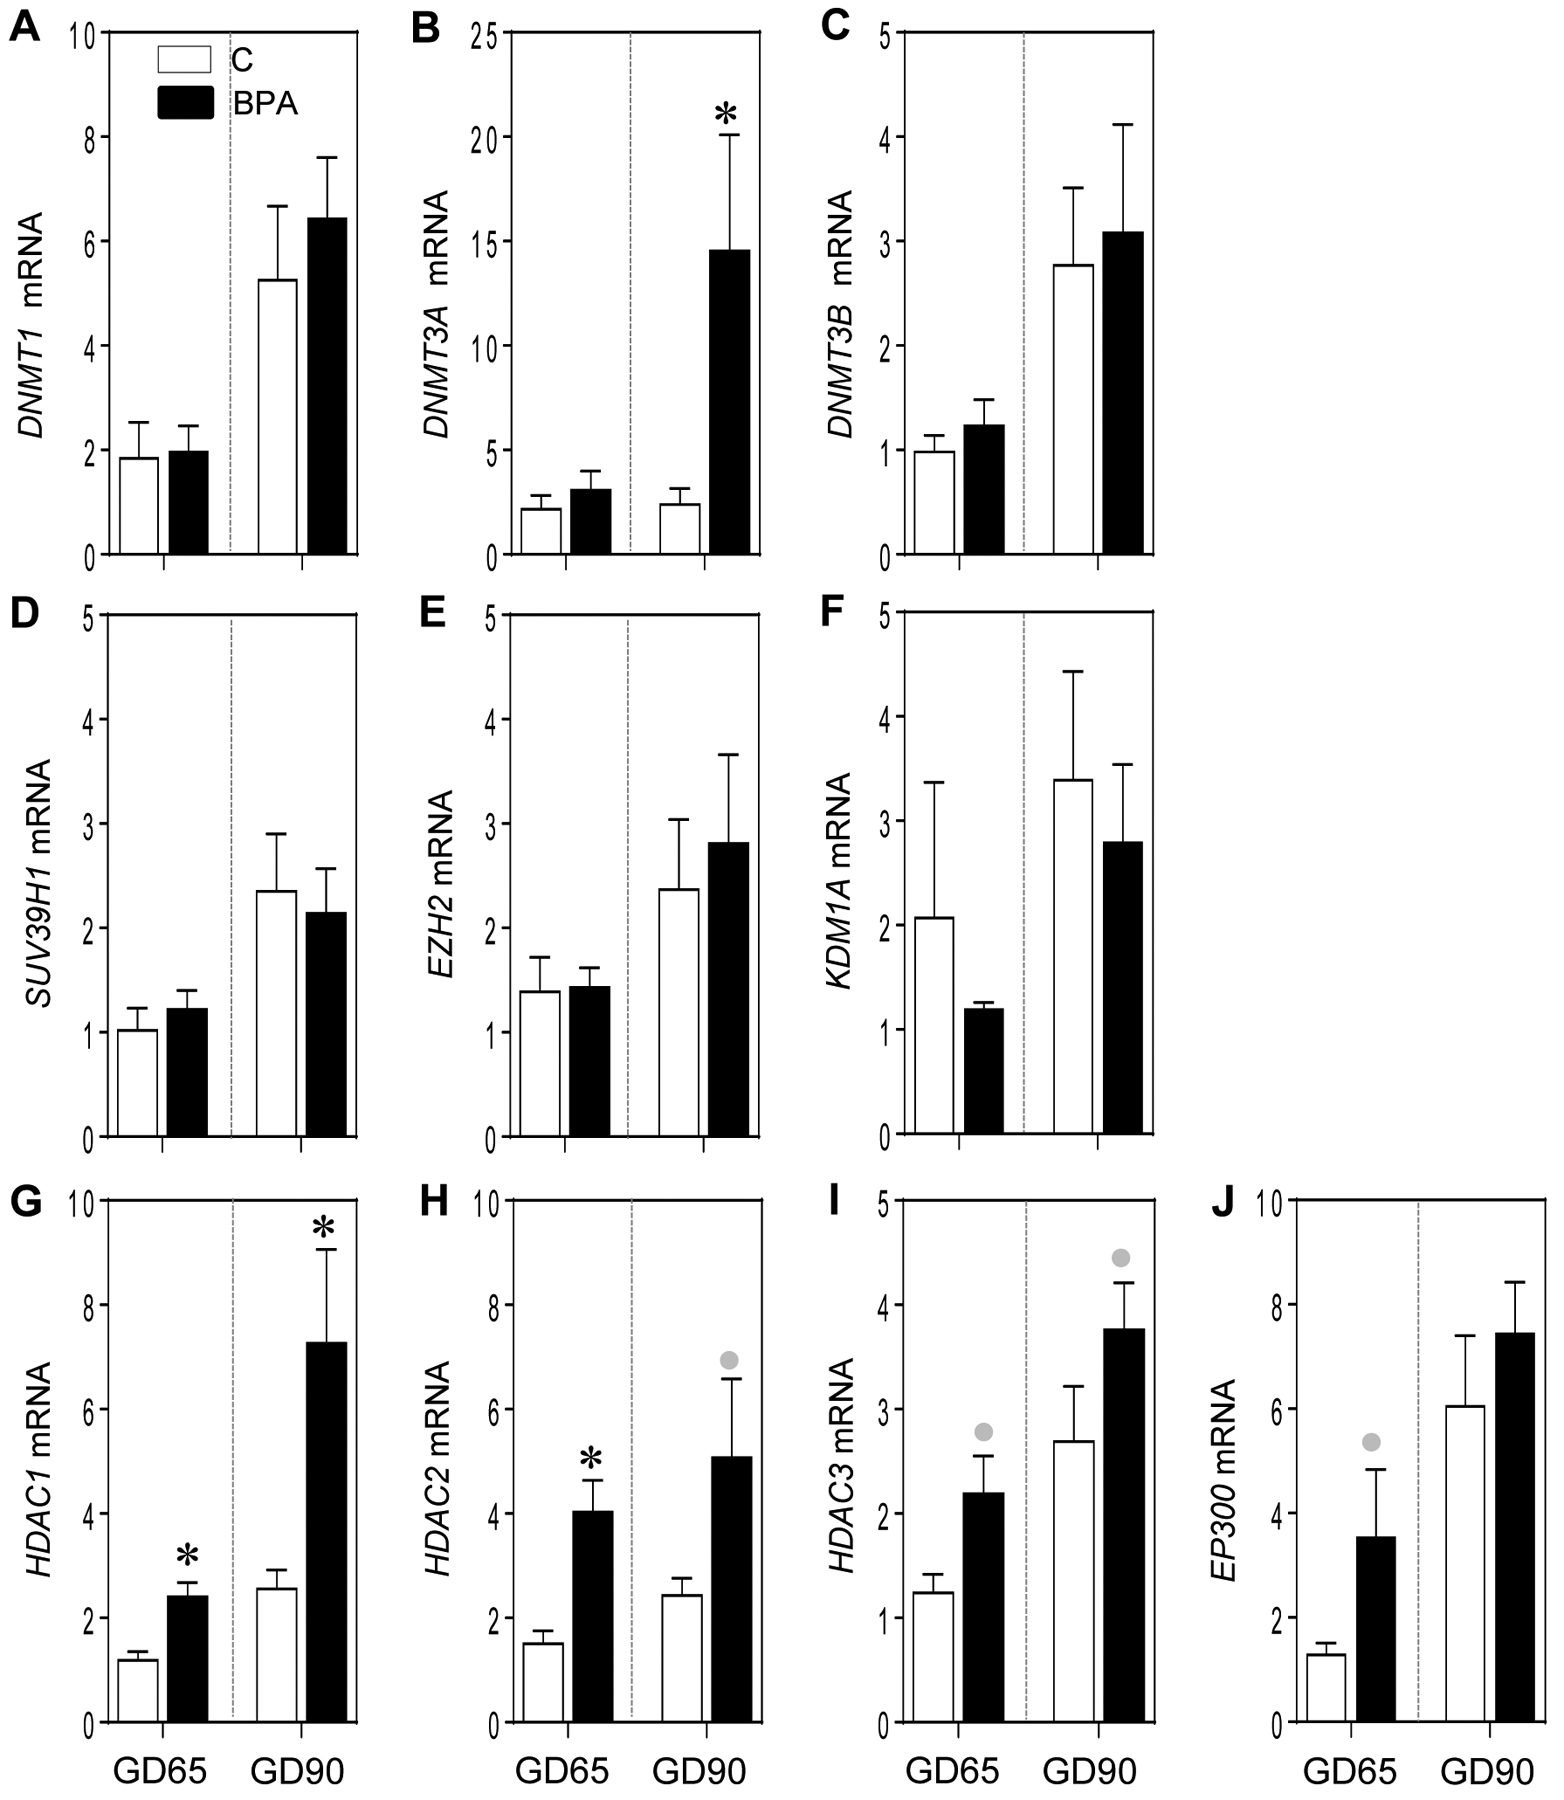
Figure 6:

Mean ± SEM of fold change in mRNA expression of epigenetic modifying enzymes: DNA methyl transferases (DNMT1, DNMT3A and DNMT3B; A, B and C, respectively), histone methyl transferases (SUV39H1 and EZH2, D and E, respectively) and histone demethylase (KDM1A; F), histone deacetylases (HDAC1, HDAC2 and HDAC3; G, H and I, respectively) and histone acetyl transferase (EP300; J) at GD65 and GD90 from control (C) and BPA exposed pregnant sheep are shown. * = p < 0.05 by Student’s t-test and grey circles indicate large effect size by Cohen’s effect size analysis.
