Figure 1.
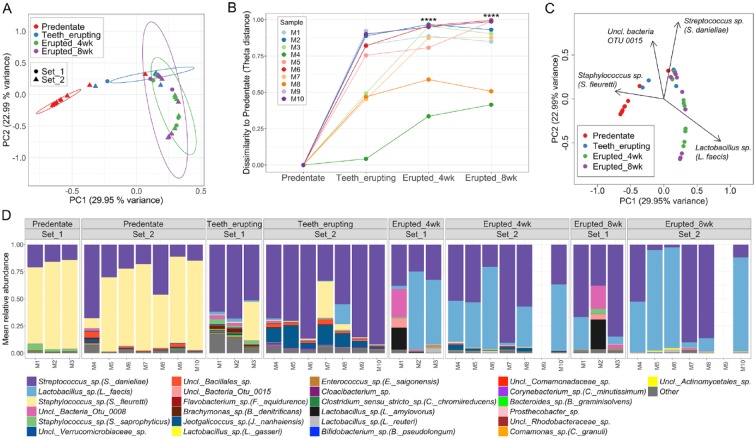
Tooth eruption is a critical event during establishment of oral microbiome communities. (A) Principal coordinates analysis (PCoA) plot of community structure, based on θYC distances, depicting that predentate oral microbial communities cluster apart from communities at later timepoints when teeth are present. Additionally, oral communities belonging to the teeth erupting timepoint are significantly different to those of 4 wk and 8 wk of age. Each sphere represents 1 sample from an individual mouse. ***P < 0.001 as determined by analysis of molecular variance (AMOVA) comparing all groups (P < 0.001 predentate vs. all other timepoints, and P < 0.001 teeth erupting vs. erupted 4 wk and vs. 8 wk). 95% confidence ellipses are also shown. (B) Changes of microbiome similarity for each mouse pup. Points indicate theta dissimilarity at each time point compared to predentate for each mouse. Lines connect points from same mouse. ****P < 0.0001, determined using Friedman Test and Dunn’s multiple comparisons test. (C) PCoA plot of microbial community structure (based on θYC distances), in which black arrows denote operational taxonomical units (OTUs) significantly correlated with principal coordinate axes, and hence, are major segregation drivers for these microbial communities. Depicted OTUs remained significant (P value < 0.001) upon correcting for multiple comparisons using the false discovery rate (FDR) correction. (D) Relative abundance plot showing main OTUs across communities at predentate, teeth erupting, erupted 4 wk, and erupted 8 wk timepoints. Set 1 and 2 refer to two independent mouse litters analyzed for these experiments. Species level taxonomy is reported in parentheses when >97% similarity was achieved. Each bar represents an individual mouse. Empty bars represent missing samples.

