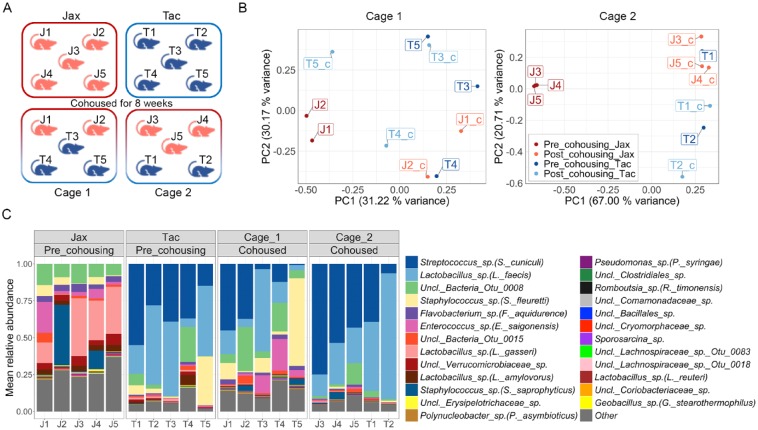
Figure 5.
Oral microbiome changes during cohousing of Jax and Tac mice. (A) Diagram representing the experimental scheme utilized to evaluate horizontal transfer of oral microbiome through cohousing of Tac and Jax mice for 8 wk (Jax mice indicated by label and red color, Tac mice by label and blue color). (B) Principal coordinates analysis (PCoA) plots of community structure (based on θYC distances), depicts microbial communities of Jax and Tac mice before and after 8 wk of cohousing per cage. Each sphere represents a sample from an individual mouse, labeled with their unique identifier (J1 to J5 for Jax mice and T1 to T5 for Tac mice). ***P < 0.001 as determined by Analysis of Molecular Variance (AMOVA), comparing pre- and postcohoused samples for Jax and Tac. Only significant comparison was postcohousing Jax versus postcohousing Tac, and postcohousing Tac versus precohousing Jax. (C) Relative abundance plot showing main operational taxonomic units (OTUs) in Jax and Tac oral communities before and after 8 wk of cohousing. Species level taxonomy is reported in parenthesis when >97% similarity was achieved. Each bar represents an individual mouse, labeled with their unique identifier (J1 to J5 for Jax mice and T1 to T5 for Tac mice).

