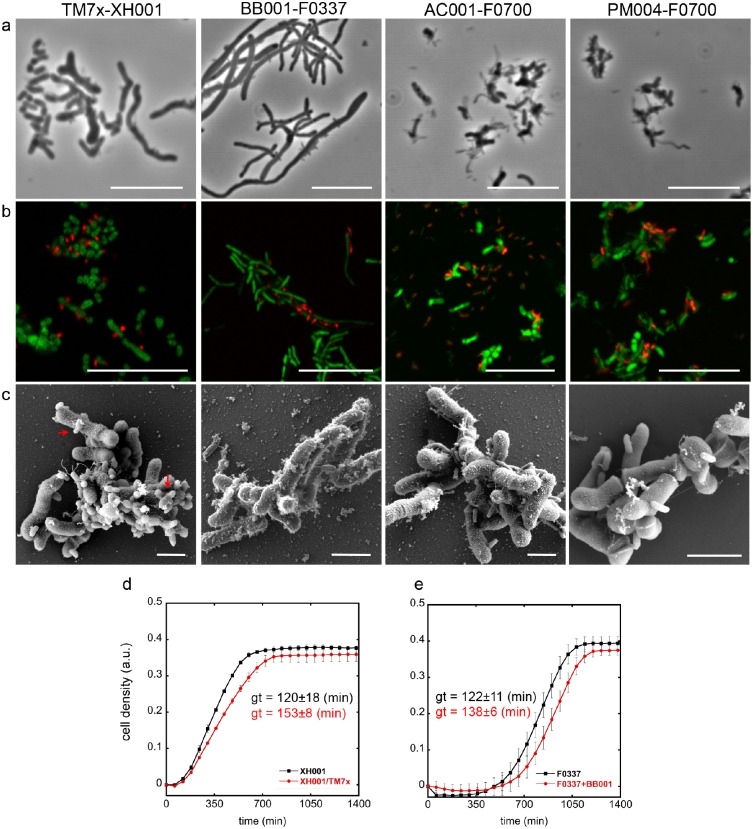
Figure 4.
Phenotypic characterization of isolated Saccharibacteria strains. (A) Phase contrast, (B) fluorescence in situ hybridization (FISH), and (C) scanning electron microscope images were taken for each Saccharibacteria strain–host binary coculture and compared with that of the monocultures (see Appendix Fig. 3). In the FISH images, red and green represent Saccharibacteria and host bacteria, respectively. Scale bars are 10 µm for phase contrast and FISH images and 1 µm for the scanning electron microscope images. Red arrows point out the “bowling pin”–like morphology of TM7x. (D, E) Growth curve of 2 Saccharibacteria–host binary cocultures (TM7x, BB001) and host monocultures were acquired with image-based cell density measurement by oCelloScope. Generation time (gt) for each mono- and coculture was determined (see Methods and Appendix Table 9) and presented next to the line graph in matching color. Values are means of 3 independent generation times with SD as an error bar.

