
FIGURE 6.
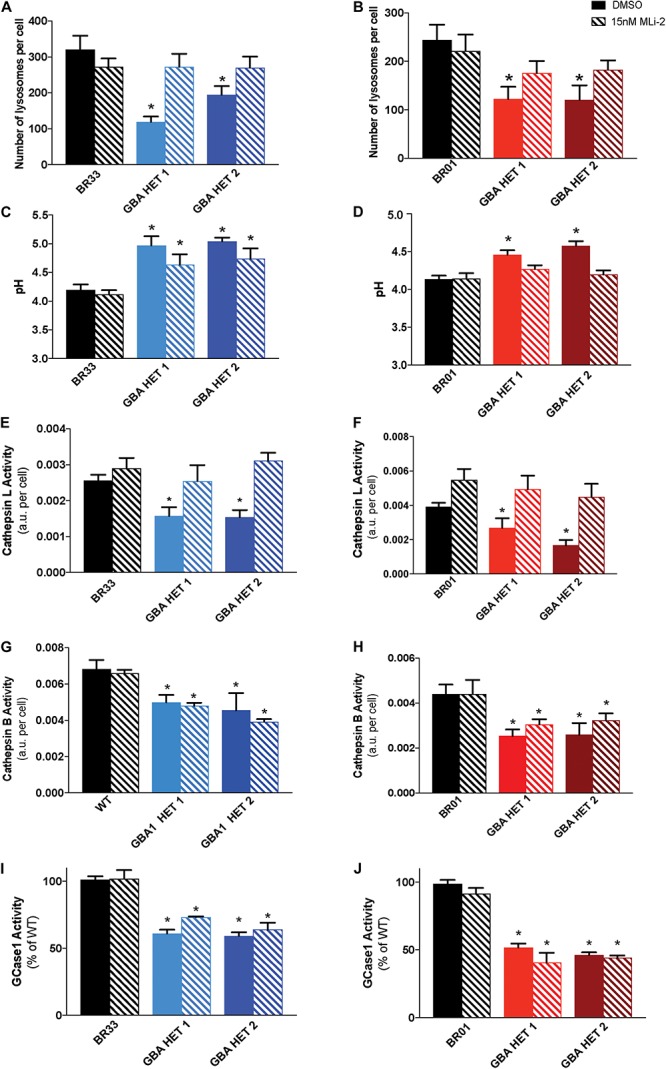
Inhibition of LRRK2 kinase activity normalizes GBA1-induced lysosomal perturbations. Lysosomal number, as detected by LysotrackerTM staining, in WT and GBA1 heterozygous-null iNs in (A) BR33 and (B) BR01 backgrounds. Lysosomal pH, as measured by LysoSensorTM, in WT and GBA1 heterozygous iNs in (C) BR33 and (D) BR01. Cells were treated with 15 nM MLi-2 for 3 days. Cathepsin L activity, as detected by enzyme specific Magic-Red dye cleavage, in WT and GBA1 heterozygous iNs in (E) BR33 and (F) BR01 backgrounds. Cathepsin B activity, as detected by enzyme specific Magic-Red dye cleavage, in WT and GBA1 heterozygous iNs in (G) BR33 and (H) BR01 backgrounds. GCase activity, as detected by GCase-specific fluorogenic substrate, was analyzed following MLi-2 (15 nM) treatment for 7 days in (I) BR33 and (J) BR01 (N = 3). All lysosomal analyses were collated from three independent experiments with 10 wells per genotype, per experiment, for each of three differentiations on 21-days old iNs (N = 3, *p < 0.0001, ANOVA followed by Tukey’s post-hoc test).