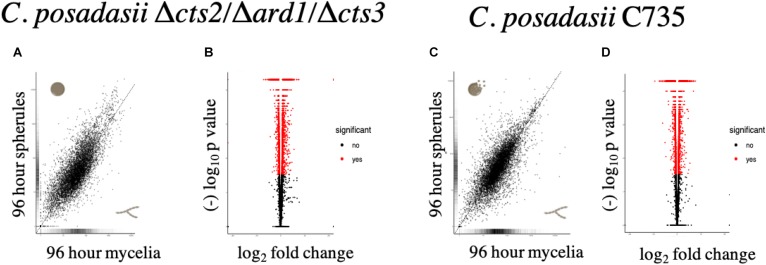
FIGURE 2.
Comparison of global transcriptome and differentially expressed genes measured between 96-h spherules and mycelia for each strain. (A,C) The global expression pattern between spherules and mycelia are similar between strains. Transcripts that fall on the line are equally expressed in both cell types. Distance from the line indicates increased transcript abundance for spherules (y-axis) or mycelia (x-axis). (B,D) Using an FDR p < 0.05 there were 4,646 differentially expressed genes (2,409 up-regulated) in the mutant strain and 4,020 differentially expressed genes (2,118 up-regulated) in the parent strain.

