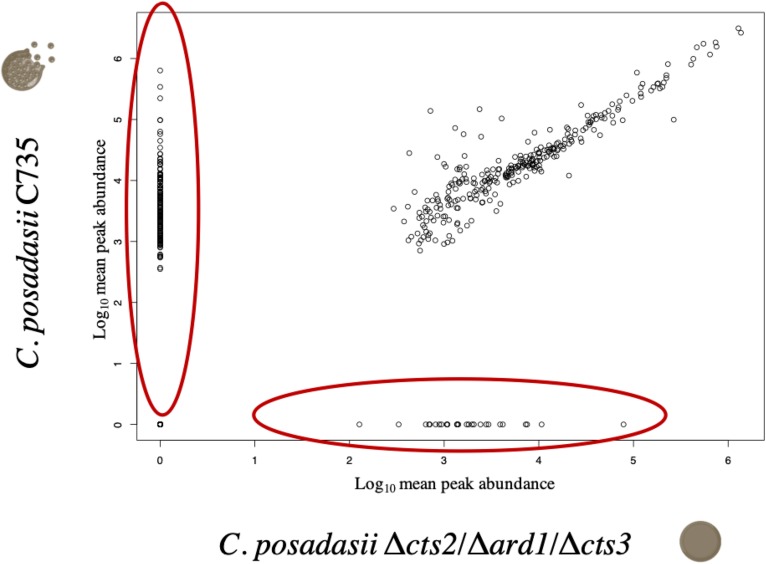
FIGURE 9.
Comparisons of the volatile metabolomes of 96-h spherules for C. posadasii strain C735 and attenuated mutant (Δcts2/Δard1/Δcts3). Individual circles represent log-transformed mean peak abundance across three biological replicates. Compounds in large red oval on the y-axis are the 130 significant VOCs uniquely produced by C735 (n = 40; FDR p < 0.05) or uniquely consumed by Δcts2/Δard1/Δcts3 (n = 90; FDR p < 0.05). Compounds in large red oval on the x-axis are the 28 VOCs uniquely consumed by C735 (n = 12; p < 0.05) or uniquely produced by Δcts2/Δard1/Δcts3 (n = 16; p < 0.05).

