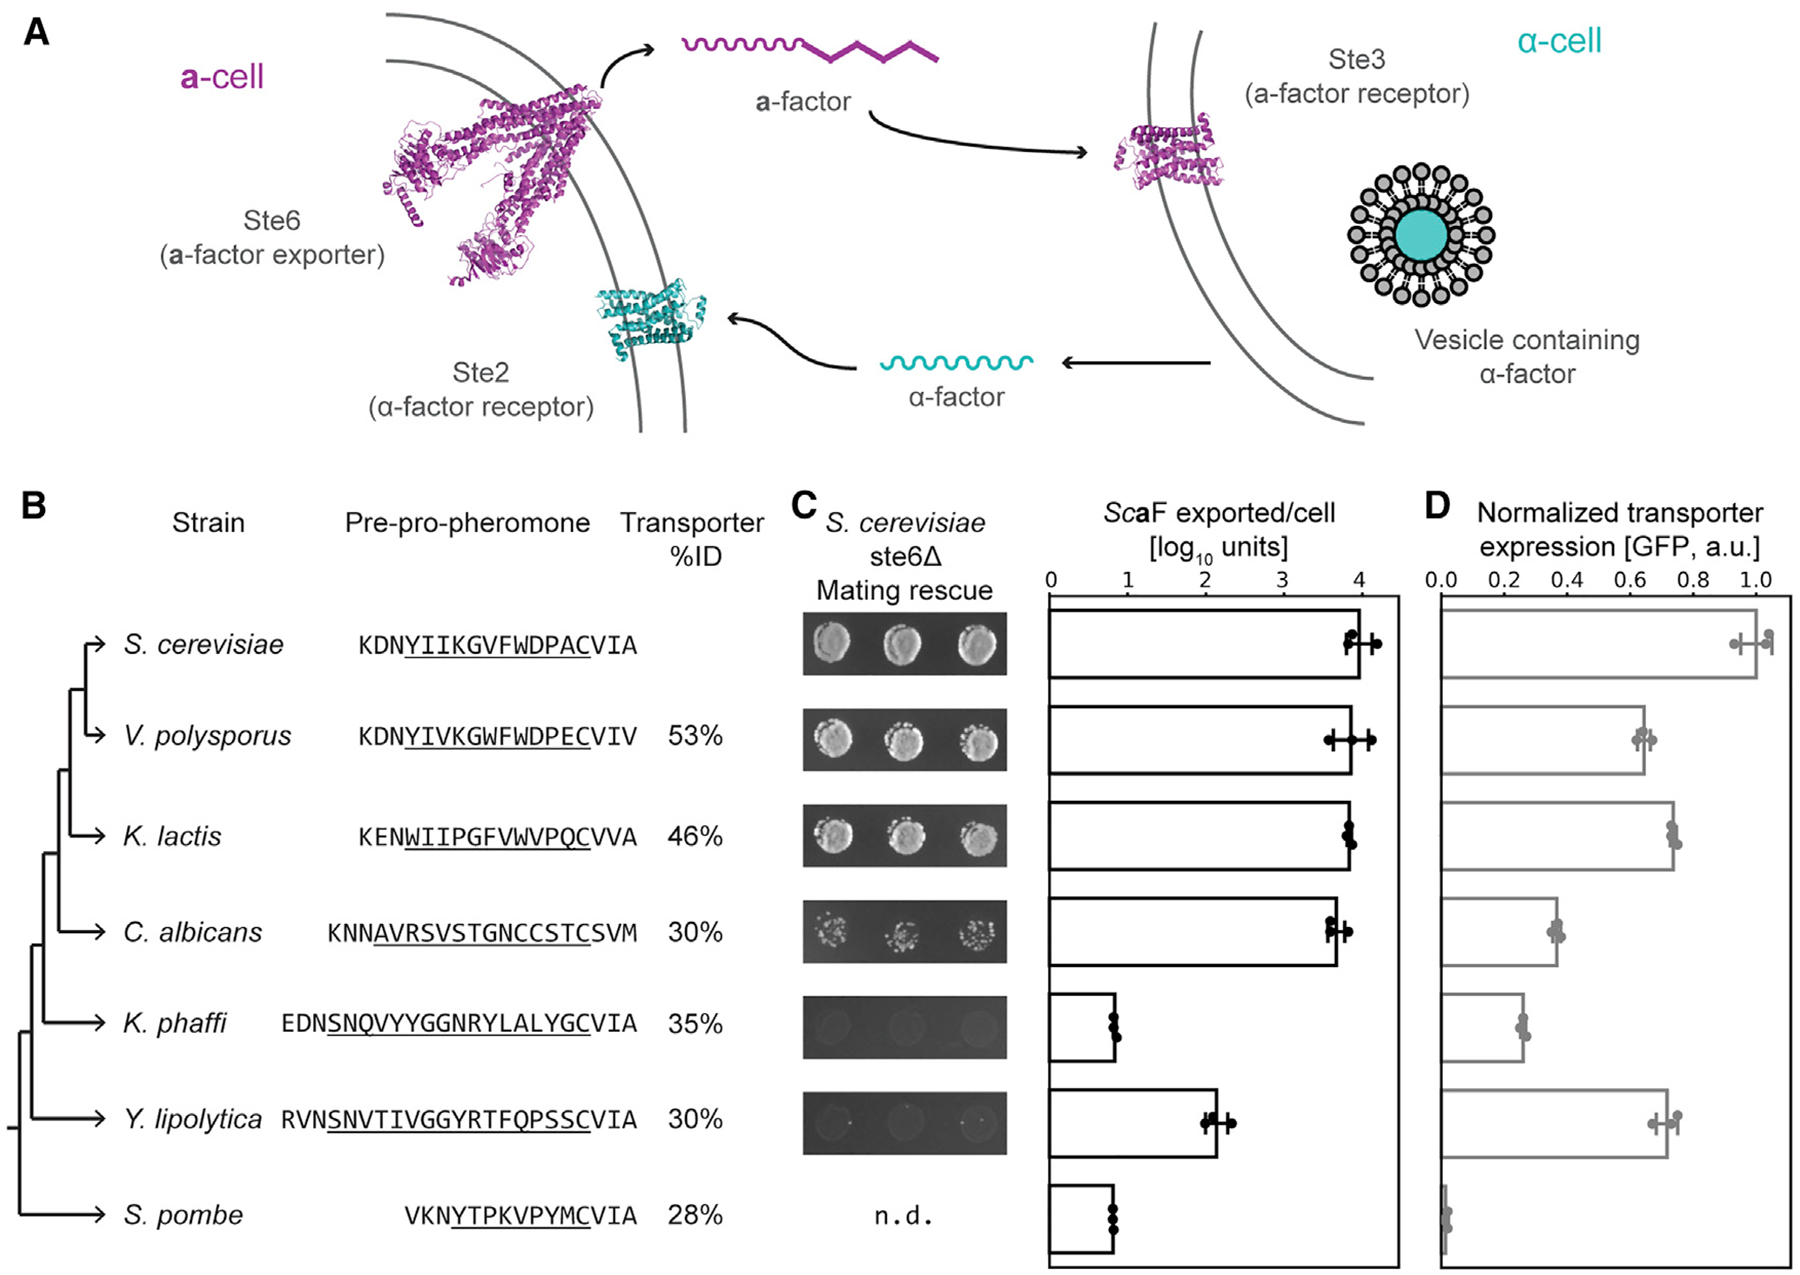
Figure 1. Homologous Pheromone Transporters Can Partially Rescue a-Factor Export from S. cerevisiae.

(A) Mating in fungi is initiated by a two-way pheromone communication between haploids of different mating types. In S. cerevisiae, a-cells secrete the 13-amino-acid peptide α-factor (α F) via secretory vesicles; α F is recognized by a G-protein coupled receptor (GPCR), Ste2, on a-cells. The farnesylated 12-amino-acid a-factor is made in the cytoplasm of a-cells; exported by a dedicated ABC exporter, Ste6; and recognized by a different GPCR, Ste3, on α -cells.
(B) A cladogram of the yeasts used in this study, highlighting the sequence of a-factor-like pheromones (mature peptides are underlined and only a portion of the N-terminal region of the initial peptide is shown) [11, 19–21], and the % identity of orthologous pheromone transporters to S. cerevisiae Ste6 is shown.
(C) Bioassays to measure Sca-factor export from ste6Δ S. cerevisiae a-cells that express orthologous pheromone transporters (the transporter sources are the species aligned in B). Left: Sca-factor export measured indirectly via mating rescue is shown (n.d. is not determined). Right: Sca-factor export measured by purifying a factor from culture and quantifying its ability to arrest α -cells (see STAR Methods for details). ScaF exported/cell is the log10 value of the fraction of dilution factor of extract that can still arrest α -cell growth to the number of a-cells used to collect the extract. Raw data from biological triplicates are plotted as dots with average plotted as bar graphs with standard deviations.
(D) The expression of Ste6 homologs, measured by flow cytometry as the median fluorescent signal of cells expressing GFP-tagged transporters (~30,000 events). Normalized fluorescence (empty plasmid control set to 0 and ScSte6 set to 1) data from biological triplicates are plotted as dots with average plotted as bar graphs with standard deviations.
See also Figure S1.
