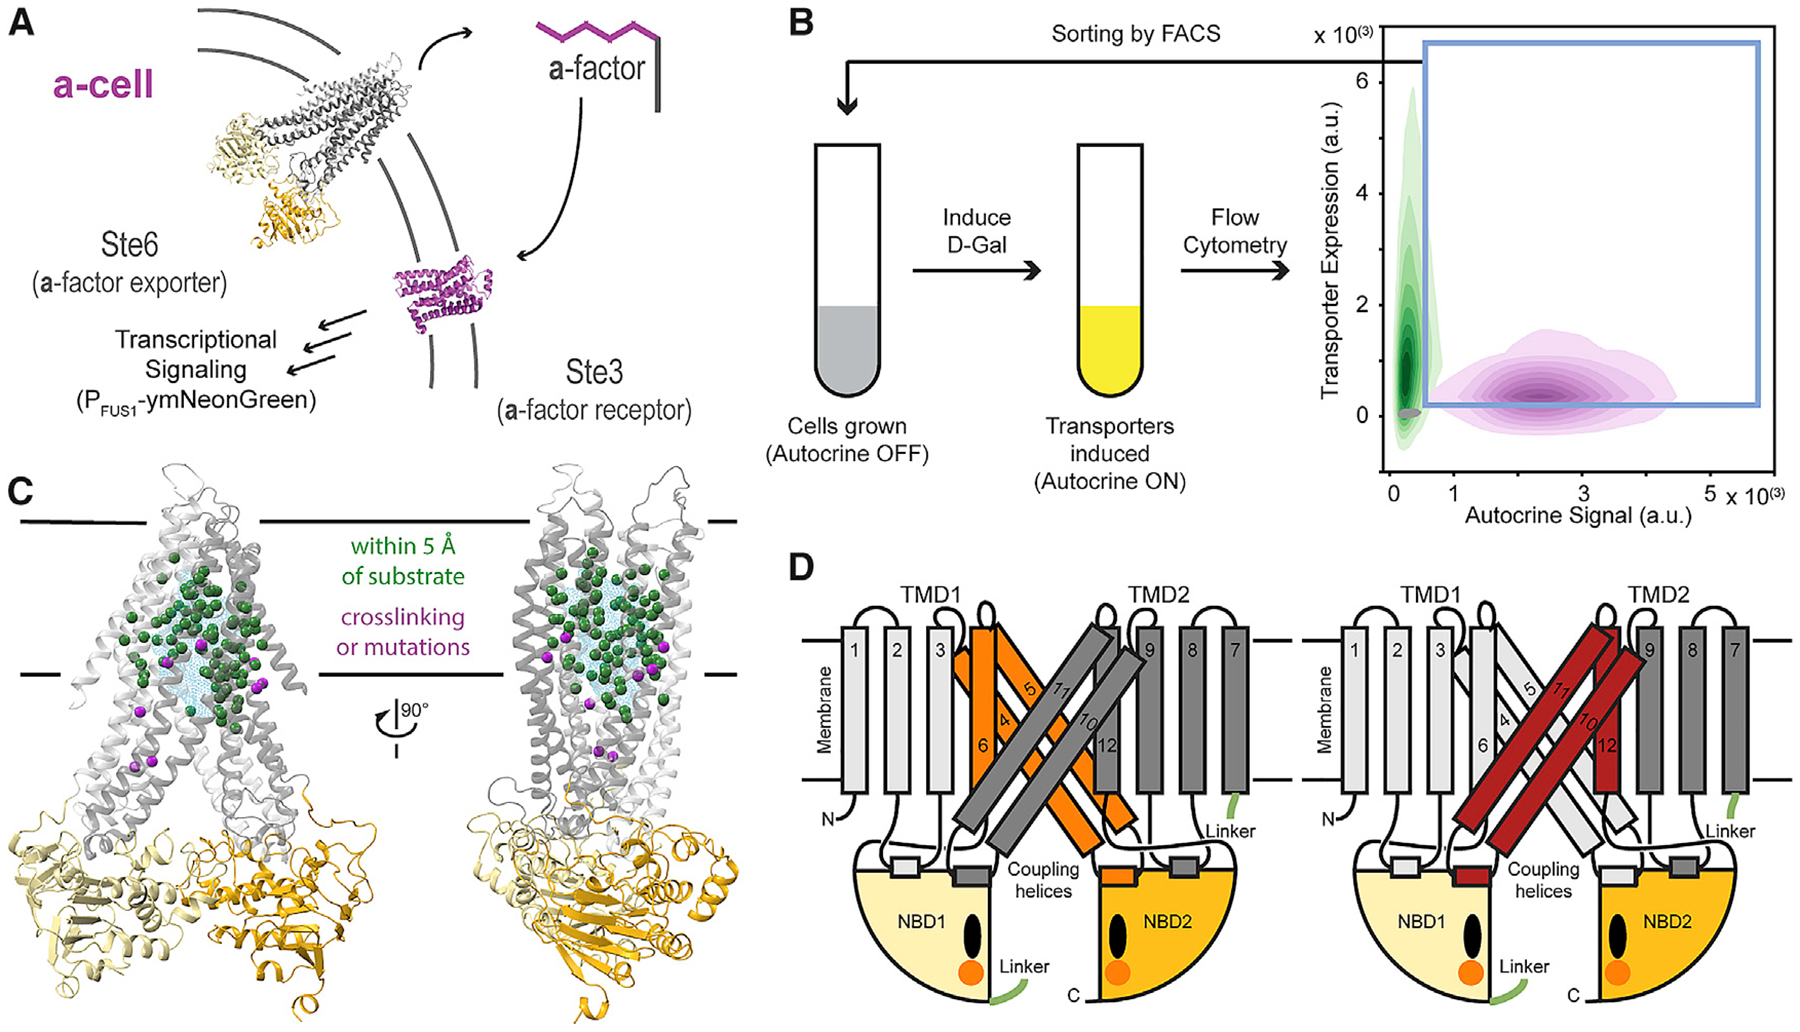
Figure 2. Two-Color Autocrine System Allows for Selection of Cells Expressing Transporters Functional in the Export of S. cerevisiae a-Factor.

(A) An autocrine system was designed in a-cells by inducibly expressing the a-factor-sensitive GPCR (PGAL1-STE3) and a-factor transporter (PGAL1-STE6) and including a transcriptional reporter for pheromone stimulation (PFUS1-mNeonGreen) [28].
(B) Schematic of a round of enrichment for increased a-factor secretion. A period of replicative growth with the autocrine system OFF is followed by FACS after turning the autocrine reporter ON (indicated by gray to yellow change). Cells were gated on both transporter expression and autocrine signal (blue box) and sorted into autocrine OFF media for expansion before the next round of selection. The 2D histogram shows the flow cytometry signal for populations of cells expressing ScSte6 (magenta), YlSte6 (green), and autocrine OFF YlSte6 (gray). Populations (n > 25,000 events) are plotted as density contours of autocrine reporter signal and transporter expression signal.
(C) Model of YlSte6 (in its inward-open conformation) highlighting positions proximal to substrate density (Cα as green spheres) in structures of three ABC proteins (P-gp bound to Zosuquidar, PDB: 6FN4; P-gp bound to QZ-Ala, PDB: 4Q9I; MsbA bound to LPS, PDB: 5TV4; and MRP1 bound to Leukotriene C4, PDB: 5UJA) and positions homologous to residues in TAP and P-gp that have been shown to affect substrate recognition by crosslinking, allelic variants, and constructed mutations (magenta spheres) [2]. The cyan mesh shows the cumulative density of substrates listed above.
(D) Schematic of YlSte6 to illustrate the contiguous TM4–6 (orange, left) and TM10–12 (brick red, right) regions chosen for library construction. These TMs contain many positions highlighted in the model in (C) and combine to form the cytoplasm-facing cavity in the inward-open state. TMD1 and TMD2 are shown in grays, NBD1 and NBD2 in yellows, nucleotide as black ovals, and Mg2+ as orange spheres.
See also Figures S1 and S2.
