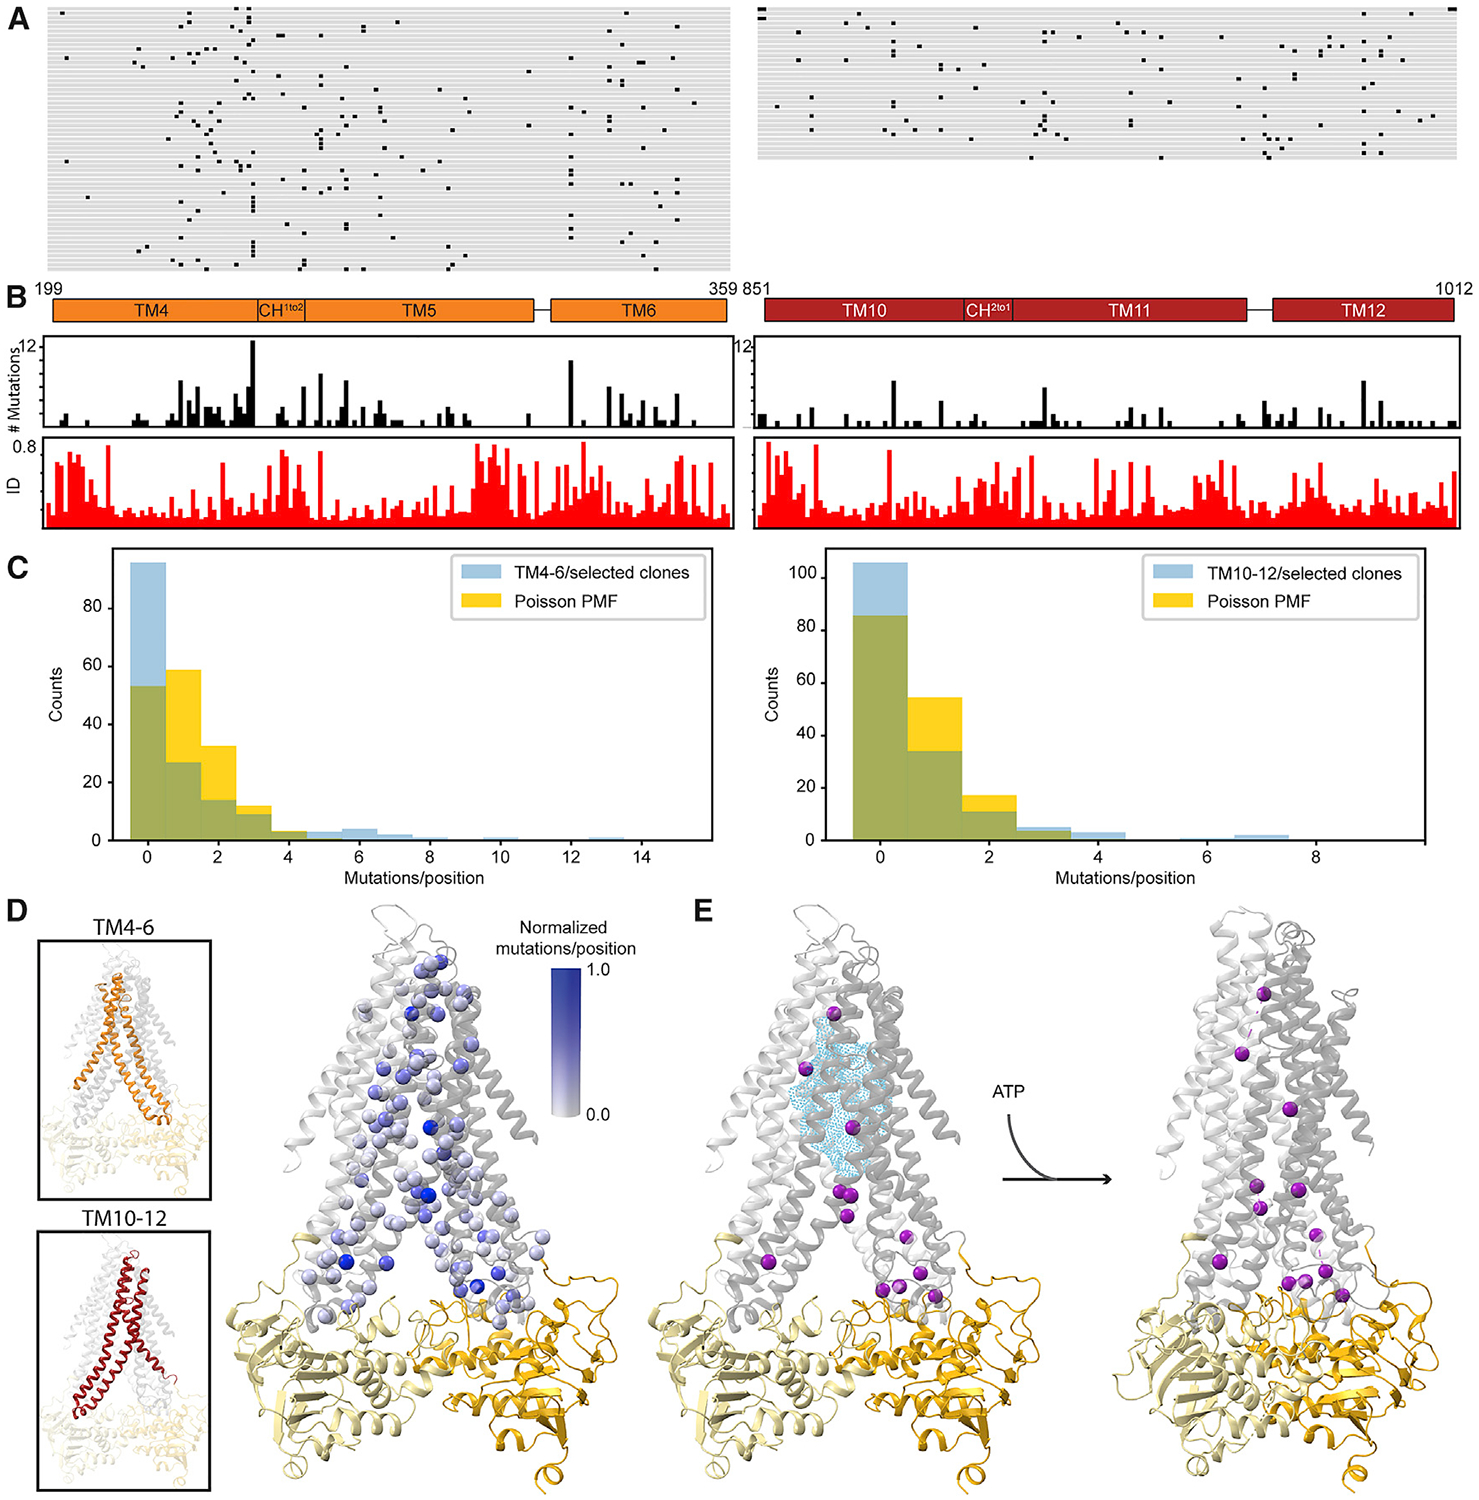
Figure 3. Mutations across the Entire Mutagenized Region Can Increase Autocrine Signaling.

(A) Plasmids that conferred increased autocrine signaling from the TM4–6 and TM10–12 libraries were sequenced, and the translated regions of interest are aligned to WT YlSte6 with positions of non-synonymous mutations marked in black for each clone. On the left are the 59 unique clones (90 sequenced total) selected from TM4–6 libraries and on the right are the 33 unique clones (153 sequenced total) selected from TMs10–12 libraries.
(B) The number of mutations at each position summed over all unique selected clones is plotted in black bar plots for TM4–6 (left) and TM10–12 (right). The fractional mean pairwise sequence identity of residues in aligned fungal Ste6 sequences across the mutagenized regions TM4–6 (left) and TM10–12 (right) calculated from an alignment of 1,126 fungal pheromone exporters are plotted in red bar plots. The TM boundaries are schematized in orange (TMs 4–6 and coupling helix CH1to2; residues 199–359) and red (TMs 10–12 and coupling helix CH2to1; residues 851–1,012) above the bar plots.
(C) Histogram of number of mutations per position summed over all unique selected clones from TM4–6 (left) and TM10–12 (right) libraries. The histogram of the mutations/positions (blue) has a longer tail than a Poisson probability mass function (PMF) distribution of the same number of mutations (gold). Chi-square (X2) goodness-of-fit test statistic for TM4–6 is 3.2 3 107 (p ~ 0) and for TM10–12 is 5.7 × 10³ (p ~ 0) against a Poisson distribution of the same number of mutations.
(D) The normalized (relative to the frequency of the most mutated position in each library) number of mutations per position is mapped on the inward-open homology model of YlSte6 with the corresponding Cα spheres colored white to blue proportional to the values plotted in (B). The insets highlight the symmetric regions TM4–6 and TM10–12 that are mutated in our libraries.
(E) Statistically enriched positions in our selected clones (magenta Cα spheres) are mapped on the inward-open (left) and outward-open (right) homology models of YlSte6. The positions were identified by considering a Poisson distribution with same mean as our observed data (C) as a null expectation. Our enrichment threshold is that the observed mutations-per-position value is 10-fold higher than that predicted by the Poisson distribution. The thresholds are ≥6 for TM4–6 clones and ≥5 for TM10–12 clones, yielding 12 positions (9 from TM4–6 and 3 from TM10–12). The cyan cloud represents cumulative substrate density from aligned substrate-bound structures of P-gp, MsbA, and MRP1 as in Figure 2C.
See also Figure S3 and Mendeley Source Data File 1.
