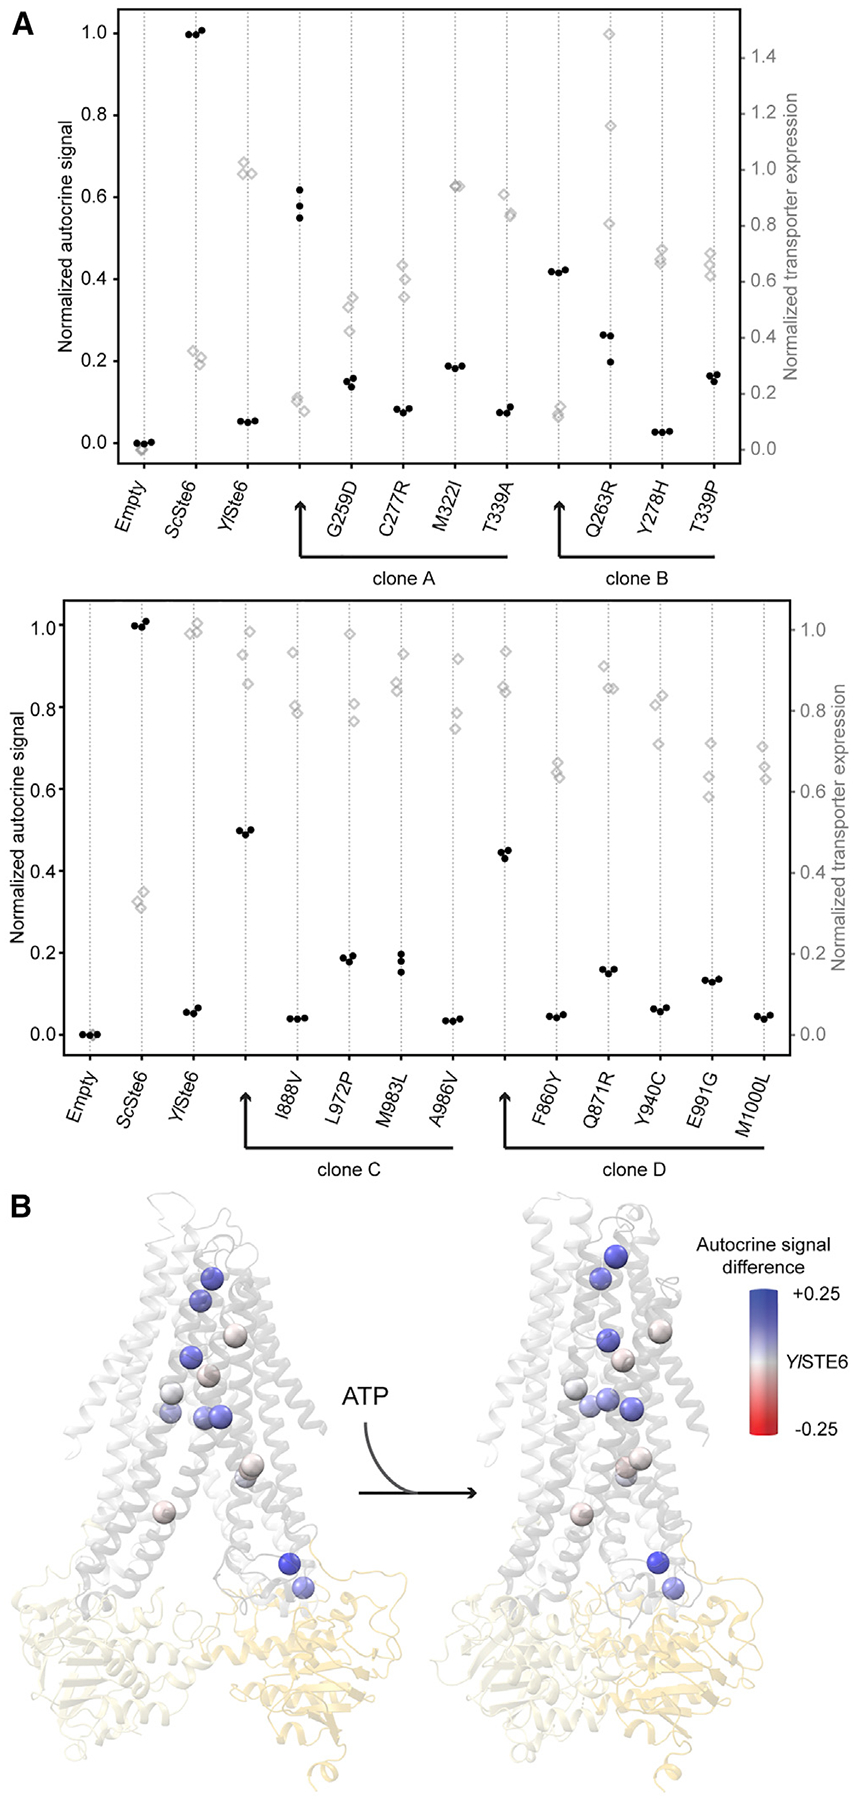
Figure 5. Effects of Individual Mutations from Selected Clones are Neutral to Positive.

(A) Mutations in clones A, B, C, and D were tested as individual mutations by the flow-cytometry-based autocrine assay, showing that many single mutations increased transport activity. Each sample was measured in biological triplicate populations (n > 25,000), and the normalized medians of the autocrine signal (black solid dots) and transporter expression (gray open diamonds) are plotted. Clones A and B from TM4–6 libraries (top) and clones C and D from TM10–12 libraries (bottom) are plotted alongside their corresponding single mutations for ease of comparison. The data were collected in high-throughput autocrine experiments (see STAR Methods) to make sure samples can be consistently compared. Common samples from the top graph are duplicated in Figure 6A (top) and Figure S6A (left); and from the bottom graph are duplicated in Figure 6A (bottom).
(B) All mutations contained in clones A, B, C, and D are plotted as Cα spheres on YlSte6 homology models and colored by autocrine signal difference values (subtracting autocrine signal of WT YlSte6). Table S1 records the values used for the structural models.
