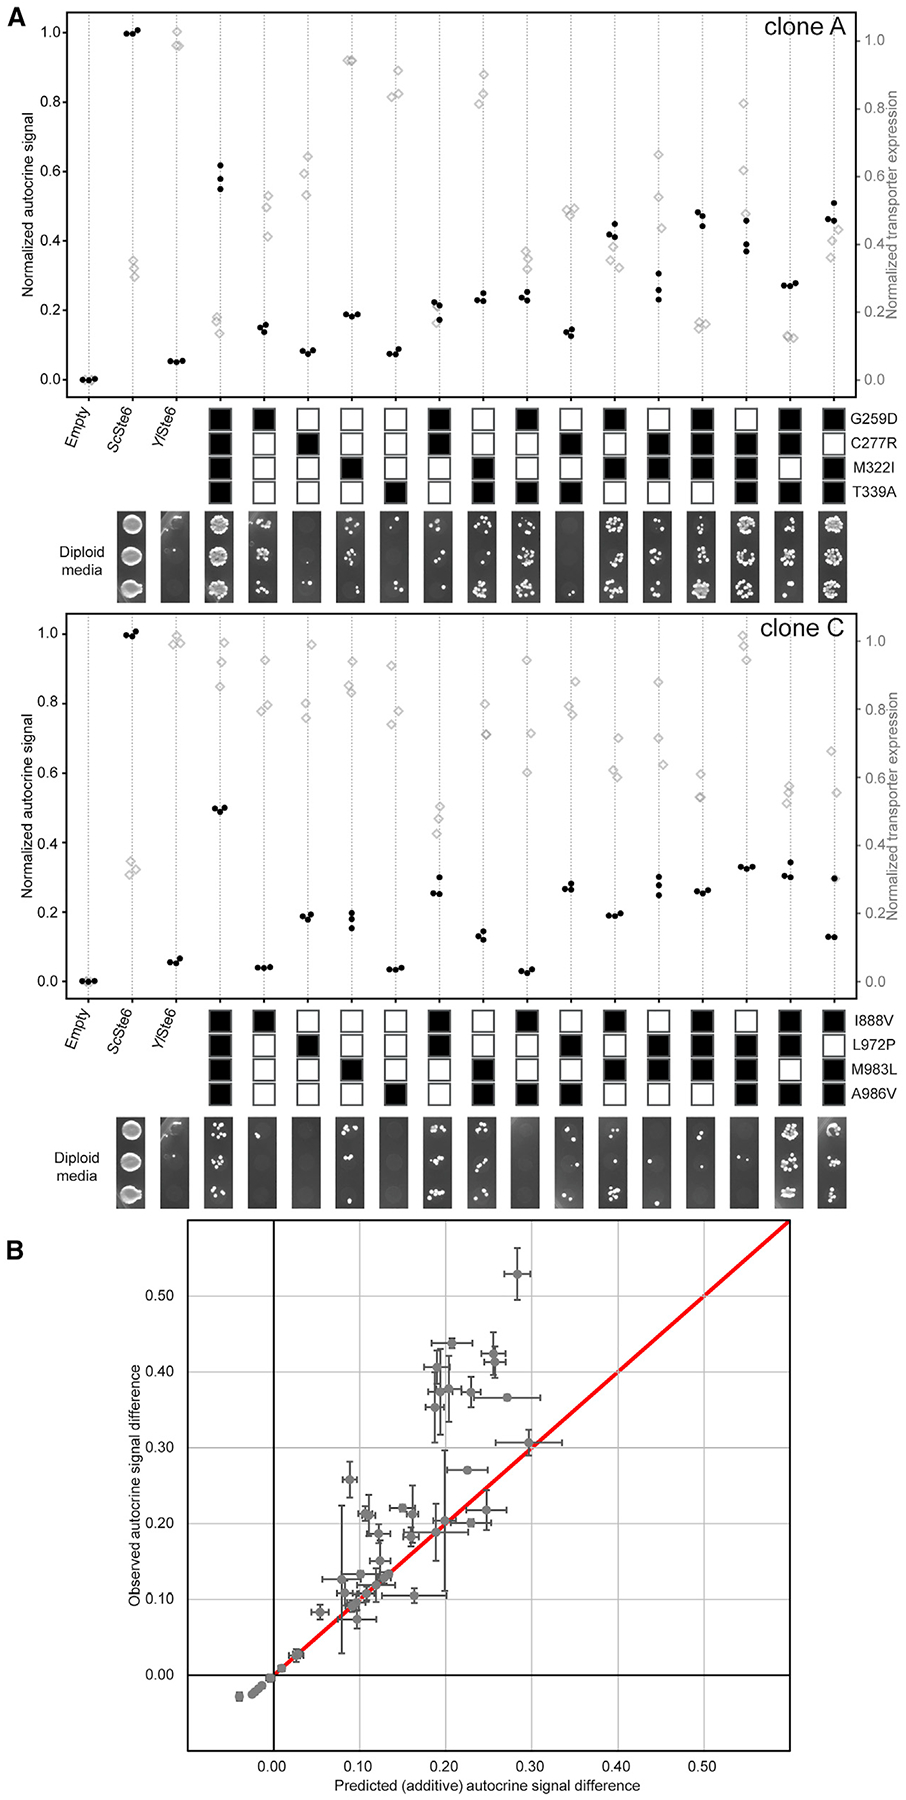
Figure 6. Mutations in Selected Clones Have Roughly Additive Effects on the Autocrine Signal.

(A) Normalized autocrine signal (black solid dots) and transporter expression (gray open diamonds) of all possible combinations of the mutations found in clones A and C were measured by using the flow-cytometry-based autocrine assay with biological triplicate populations (n > 25,000) for each sample. Combinations of mutations from clone A (top) and clone C (bottom) are represented by a series of boxes; filled boxes represent the presence of a mutation. The data were collected in high-throughput autocrine experiments (see STAR Methods) to make sure samples can be consistently compared. Common samples from the top graph are duplicated in Figure 5A (top) and Figure S6A (left); and from the bottom graph are duplicated in Figure 5A (bottom). Mating activity for cells expressing YlSte6 containing each combination of mutations is displayed below the autocrine data. The mating data for both panels were collected in a single experiment (see STAR Methods), and thus the same ScSte6 and YlSte6 expressing controls are shown in both panels for ease of comparison.
(B) Data compared to an additive model for the autocrine signal difference (subtracting autocrine signal of WT YlSte6). The model, shown as a red line, is such that the autocrine signal difference from a multiple mutant is the sum of autocrine signal difference of all single mutations it contains. The data are shown with error bars representing standard deviation of autocrine signal difference medians of biological triplicate populations.
See also Figure S6 and Mendeley Source Data File 4.
