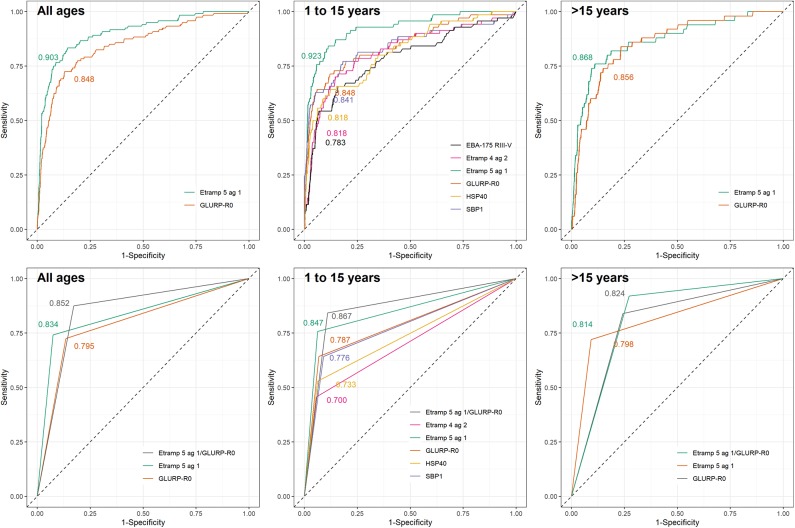
Figure 3.
Receiver operating characteristic curves for immunoglobulin G (IgG) responses to selected Plasmodium falciparum antigens using highly sensitive rapid diagnostic test (hsRDT) status as the gold standard. IgG responses in one-thirds of all EAG-Grand'Anse participants were used (i.e., the test dataset; n = 1,648) including 120 hsRDT positives (7.3%). IgG responses were defined as log10-transformed median fluorescence intensities corrected for background reactivity. Results are shown for continuous IgG responses (top) for antigens with an area-under-the-curve (AUC) > 0.8 in the training dataset (Figure 2). Seropositivity results (bottom) are only shown for antigens with an AUC > 0.8 using continuous IgG responses in the test dataset (top). AUC values are depicted on each plot. From left to right results are shown for: all ages, children aged 1 to 15 years and individuals older than 15 years.

