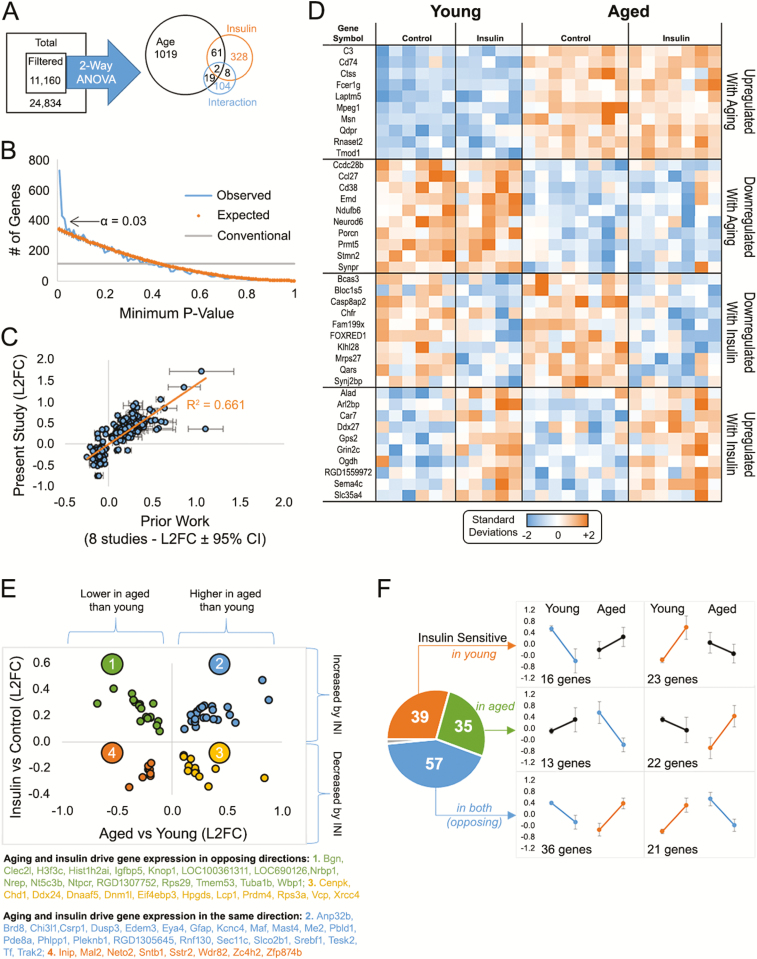
Figure 4.
Microarray analyses. (A) Total gene set filtered to remove low-intensity signals yielded 11,160 genes. Two-way analysis of variance (ANOVA) analysis from 26 animals (young saline n = 6, young aspart n = 5, aged saline n = 8, aged aspart n = 7) identified ~1,500 genes that were significant by main effects of age, insulin, and/or the interaction (B) p value frequency histogram shows the increase in the number of significant genes with α < 0.03. The conventional line (gray) delineates a cutoff for significance near 112 as the first percentile (p < 0.01) of the 11,160 filtered genes. The orange line represents the p values obtain when testing for significance across a set of 11,160 randomly generated numbers through a two-way analysis of variance (ANOVA). The blue line highlights the p values obtain from our data set. (C) We validated ~1,000 age-sensitive genes across our prior studies and found a significant correlation with prior work. (D) Heatmap of significant genes (top 10) separated across participants by aging or drug effects. Each column represents one animal and each row represents one gene. Color-coded signal intensity values (standardized: orange represents increase, blue represents decrease) are shown. (E) Genes significant by both main effects (63) fall into four categories: 2 in the same direction (quadrants 4 and 2), and 2 in the opposite direction (quadrants 1 and 3). (F) Genes within the significant interaction space (~130) are divided as those modified in young animals (top), in aged animals (middle), or in both (bottom). This result suggests insulin sensitivity in the brain may not differ across aging (39 genes changed in young, and 35 changed in aged). Data represent means ± SEM.

