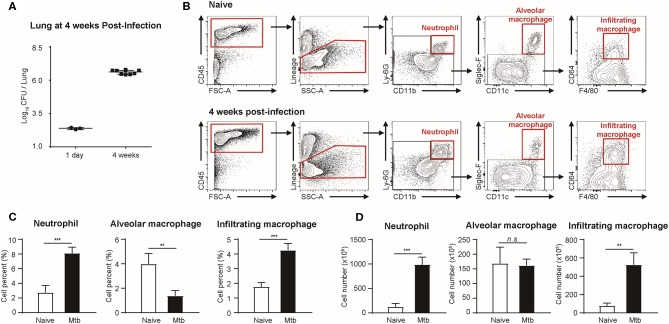
Figure 1.
Quantitative analysis of immune cell population in naïve and Mtb (Mycobacterium tuberculosis)-infected mice lungs (4 weeks post-infection). (A) colony-forming units (CFU) 1 h after (T = 1 day, n = 3) and 4 weeks after (T = 4 weeks, n = 4) infection with Mtb. (B) Gating strategy of immune cells. (C) The proportion (%) and (D) the absolute count (×105) of different subtypes of immune cells were quantified and compared between naïve and Mtb-infected groups [four mice per group, mean ± standard deviation (SD)]. Statistical analysis was performed using the Student's t-test. **P < 0.01, ***P < 0.005. n.s., not significant.

