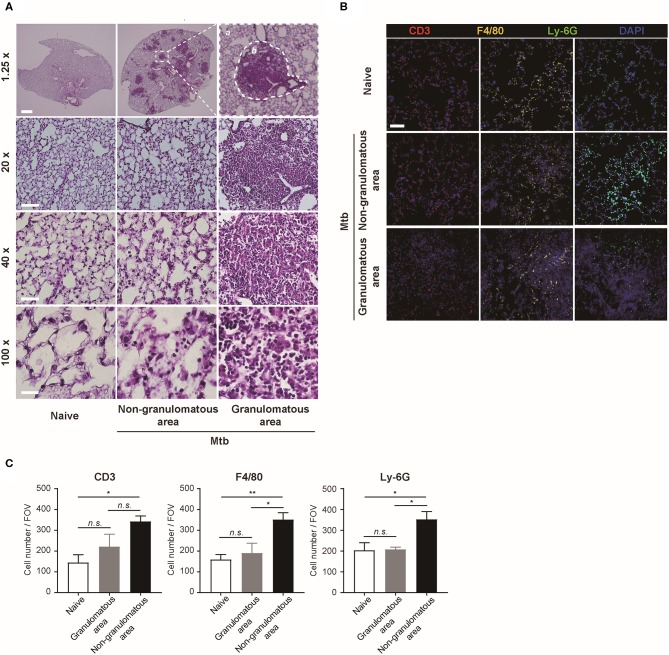
Figure 2.
Microscopic morphology and immune cell distribution in naïve and Mtb-infected mice's lungs (A) Hematoxylin and eosin (H&E) staining of naïve and Mtb-infected mice lungs (Scale bar, 1.25X: 1 mm, 20X: 100 μm, 40X: 50 μm, 100X: 20 μm). The magnified image contains a single granulomatous area (b) separating it from the non-granulomatous area (a) via a dotted line. (B) Immunofluorescence staining of naïve and Mtb-infected mice lungs to verify specific immune cell subtypes. Scale bar, 50 μm. (C) The cell counts were compared between the naïve and Mtb-infected group, including granulomatous and non-granulomatous area. Manual counting of each of the immunofluorescence-stained sections was performed [three fields per section, three sections per mouse, three mice per group, mean ± standard error of mean (SEM)]. Statistical analysis was performed using the Student's t-test. *P < 0.05, **P < 0.01. Field of view (FOV): 10.24 mm2. n.s., not significant.

