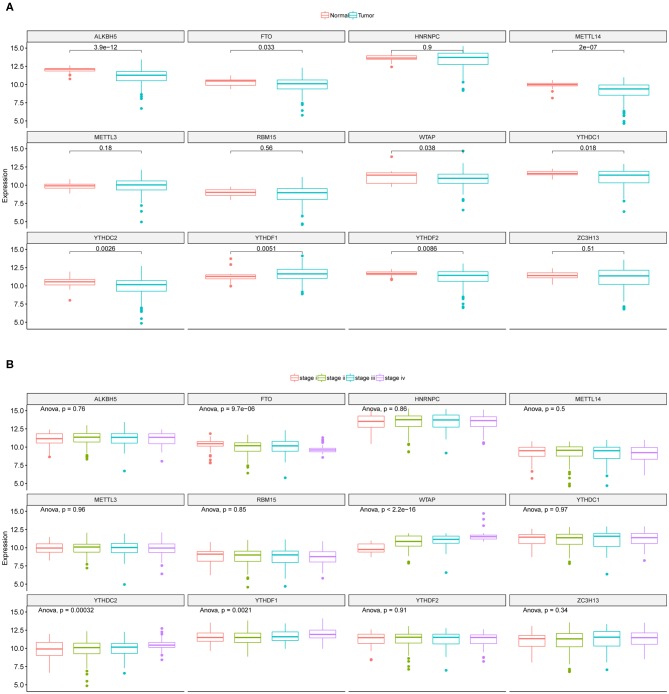
Figure 1.
Expression landscape of m6A regulators across CRC samples. (A) Boxplots illustrating m6A regulators' expression values across CRC tumor and adjacent normal tissues along with t-test p-value provided above the boxplot. (B) Boxplots illustrating the expression levels of the 12 m6A regulators across CRC tumor samples with different stages. ANOVA p-values were provided above the boxplot.

