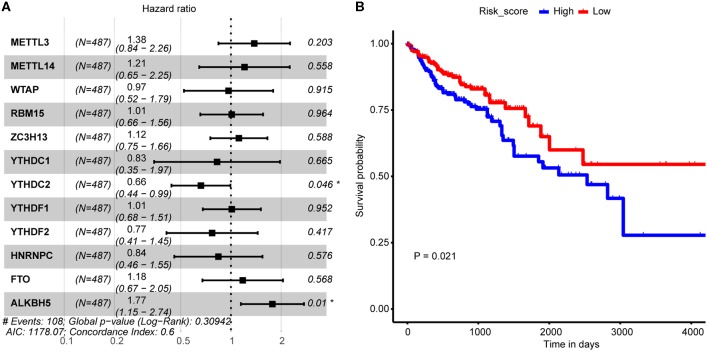
Figure 3.
Association between m6A regulator and CRC tumor samples' prognosis. (A) Forest plot shows the result of multivariate Cox-regression analysis for association between m6A regulator's expression and Kaplan-Meier estimated CRC tumor samples' overall survival probability. Values within brackets represent 95% confidence interval of hazard ratio. (B) Kaplan-Meier curves of CRC tumor samples stratified by the median risk score with log-rank test p-value provided.

