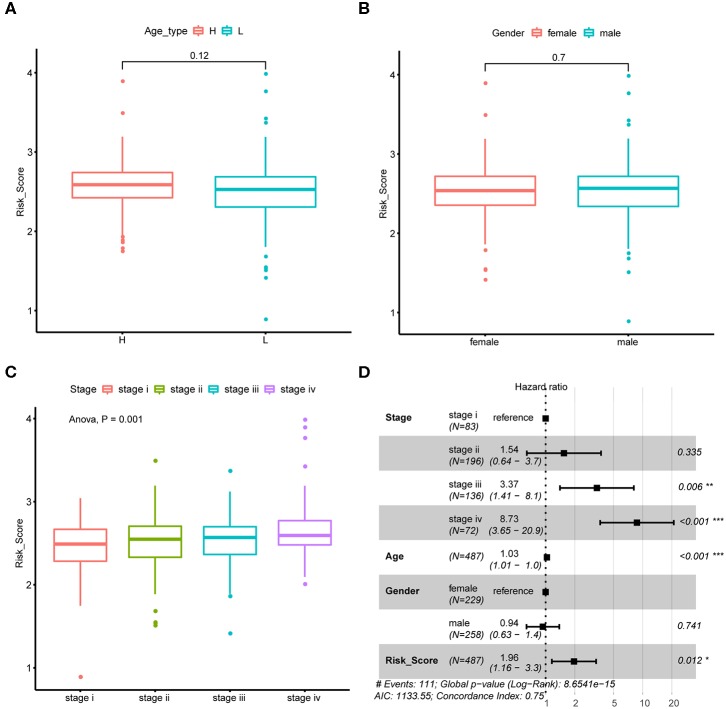
Figure 4.
Association between risk score and CRC tumor samples' epidemiologic information. (A) Boxplots show the distribution of CRC tumor samples' risk score stratified by the sample's median age. (B) Boxplots show the distribution of CRC tumor samples' risk score stratified by sample's gender. (C) Boxplots show the distribution of CRC tumor samples' risk score stratified by tumor stage. (D) Forest plot shows the result of multivariate Cox-regression analysis for association between risk score and Kaplan-Meier estimated CRC tumor samples' overall survival probability after adjusted age, gender and stage.

