
Figure 1.
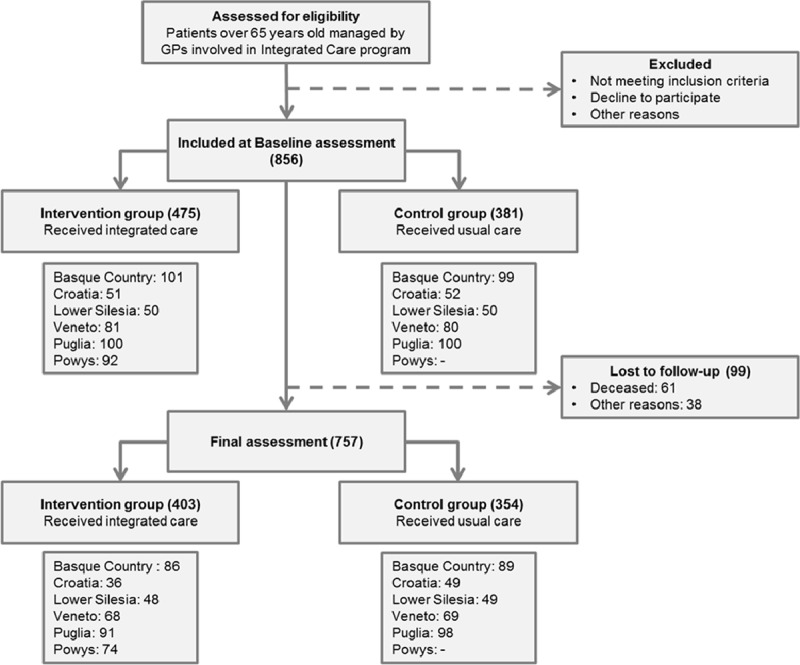
Diagram of the patients included. Flow of participants for control and intervention group, per site.
Official websites use .gov
A
.gov website belongs to an official
government organization in the United States.
Secure .gov websites use HTTPS
A lock (
) or https:// means you've safely
connected to the .gov website. Share sensitive
information only on official, secure websites.
Diagram of the patients included. Flow of participants for control and intervention group, per site.