
Figure 3.
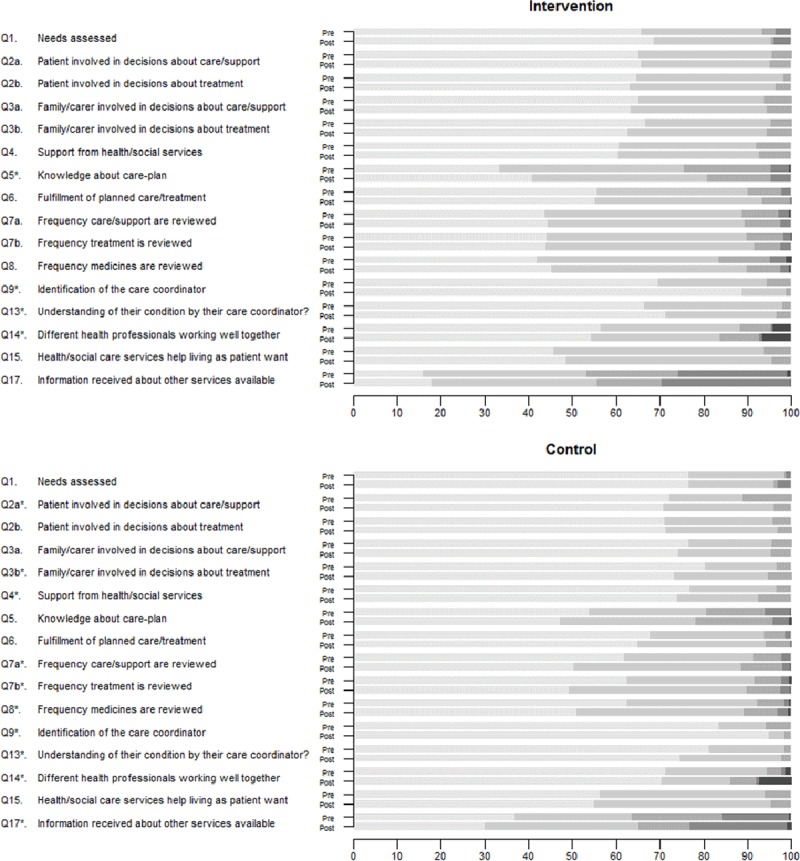
Patient’s satisfaction assessed by PIRU questionnaire: a) for intervention group and b) for control group. Data represents percentage of each category; color intensity indicates the level of satisfaction; the lighter the gray, the more satisfied are the participants; the darkest color indicates: “Don’t Know/not sure” for questions 1, 9 and 14; pre-post comparisons were performed for each group; * statistically significant difference (p < 0.05).