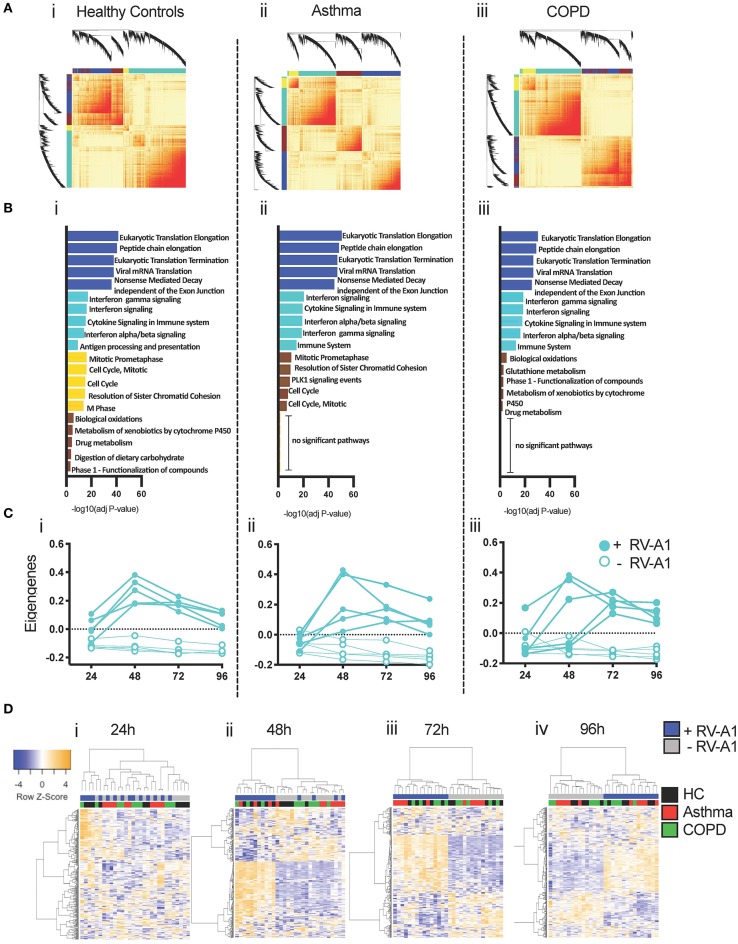
Figure 5.
Co-expression networks underlying RV-A1-driven BEC responses. (A) Heatmap illustrating the gene co-expression networks detected following RV-A1 infection of healthy donor cultures. Each gene is represented by a branch on the dendrogram. Increasing red intensity indicates increasing strength of correlation between genes and modules correspond to blocks of highly correlated genes. (B) Top five biological pathways enriched in each WGCNA module following RV-A1 infection. Data analyzed using InnateDB. (C) Dynamics of the innate turquoise module eigengene in mock (open circles) and RV-A1 infected cells (closed circles) at the indicated timepoints. (D) Heatmap of the 300 most variable genes within the turquoise module in healthy controls, asthma and COPD. Each row corresponds to a gene, and each column to a sample.

