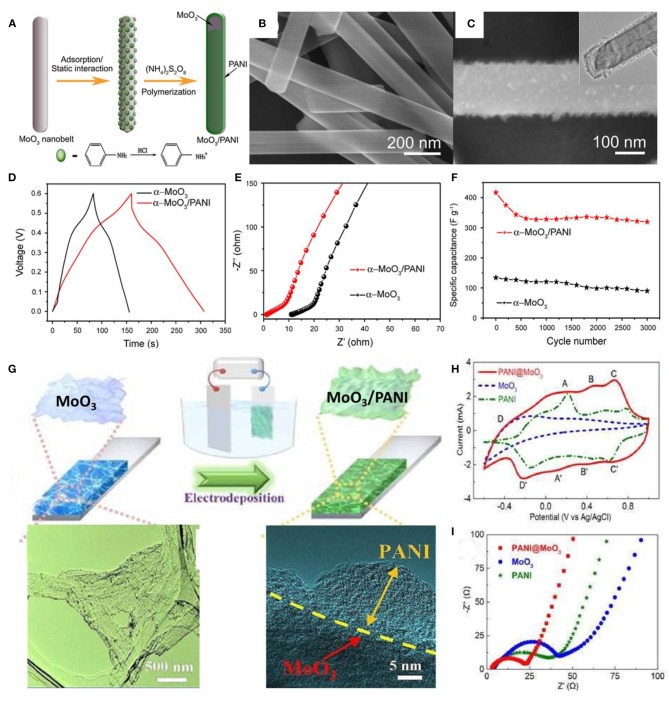
Figure 8.
(A) Schematic illustration of the formation of the MoO3/PANI coaxial heterostructure nanobelts. (B) SEM images of the original α-MoO3 nanobelts. (C) SEM images and (inset) TEM images of the as-synthesized MoO3/PANI coaxial heterostructure nanobelts. (D) A comparison of the galvanostatic charge–discharge curves of the two comparative materials at a current density of 2 A/g. (E) EIS spectra comparison and (F) cycling performance at a scan rate of 50 mV/s of the two comparative materials (Jiang et al., 2014). (G) Schematic illustration for the synthesis process of 3D MoO3/PANI hybrid nanosheet network film. (H) CV curves of MoO3, PANI, and 3D MoO3/PANI hybrid nanosheet network films in the potential range from −0.6 to 1 V at a scanning rate of 50 mV/s. (I) Nyquist plots of the MoO3, PANI, and 3D MoO3/PANI hybrid nanosheet network films (Zhang et al., 2017).

